
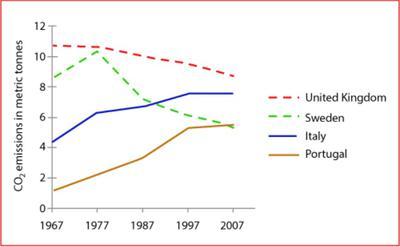
The line graph illustrates the trends of average carbon dioxide emission per person in four different countries: the United Kingdom, Sweden, Italy and Portugal,
since
the year 1967 to 2007.
Change preposition
from
Overall
, between 1967 and 2007 Linking Words
emissions
experienced a gradual Use synonyms
growth
in Portugal and Italy. In Portugal started at the lowest, approximately 1,8 tonnes and reached its first peak in 1977 at just over 2. Over the following decade, Use synonyms
however
, it saw a period of fluctuation, first increasing to 5 in 1997, and Linking Words
then
remaining stable at around 5 in 2007. Despite Linking Words
this
, in Sweden, the emission levelled off in 1977 and has not shown any significant Linking Words
further
Linking Words
growth
since Use synonyms
then
. With regard to the Linking Words
growth
rate of Italy, the graph reveals that Use synonyms
this
increased between 1977 and 2007. Linking Words
Nevertheless
, in the United Kingdom, the situation changed in 1977, which marked a sudden drop from 11 tonnes to 9. In the United Kingdom Linking Words
emissions
have been decreasing steadily.
In summary, the line graph indicates that Use synonyms
although
two in all four countries CO2 Linking Words
emissions
have had general Use synonyms
growth
over the past few decades. In spite of Use synonyms
this
, the other two countries' Linking Words
emissions
have a declining trend.Use synonyms