The given line graph illustrates the average data of a museum tourists in both summer and winter in the year 2003. Overall, it is observed that during summer, the museum had many visitors compared to winter. To begin with, the highest visits recorded were of about 1600 people to the museum at 12noon during the hot weather which declined to 800 people at 4pm. Whereas in winter about 500 visitors came at 10am which somewhat fluctuate till 12 noon. However, there was massive declined during the winter at 12noon till around 2pm whereas there was no visitors recorded from 2pm till 6pm unlike during summer, the downward trend was only from 4pm and there was no record of no visitors.

The given line graph illustrates the average data of a museum tourists in both summer and winter in the year 2003.

Overall, it is observed that during summer, the museum had many visitors compared to winter.

To begin with, the highest visits recorded were of about 1600 people to the museum at 12noon during the hot weather which declined to 800 people at 4pm. Whereas in winter about 500 visitors came at 10am  which somewhat fluctuate till 12 noon.

However, there was massive declined during the winter at 12noon till around 2pm whereas there was no visitors recorded from 2pm till 6pm unlike during summer,  the downward trend was only from 4pm and there was no record of no visitors.
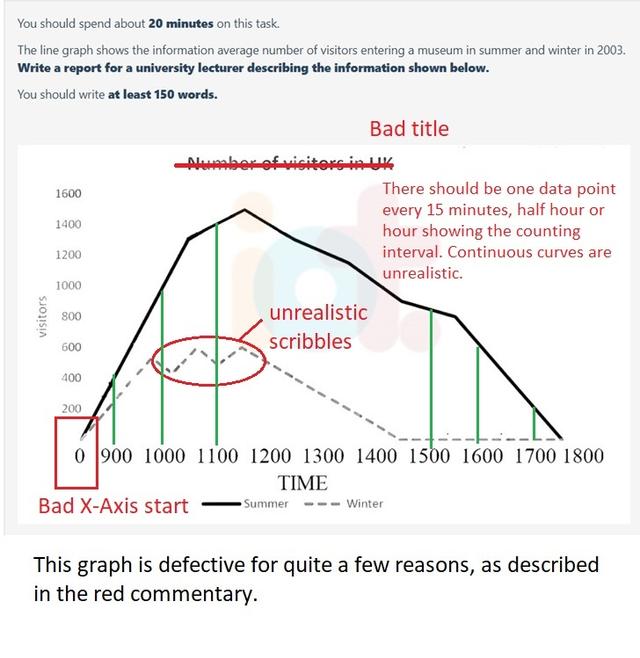
The line chart compares the average number of
visitors
in the United Kingdom who visited the museum in two seasons,
summer
and winter, in 2003. In general, the total number of
visitors
in the
summer
was always higher than in the winter. The
trend
was gradually increased until 12
p
.
m
. After 12
p
.
m
., the chart shows a decreasing
trend
in both seasons. In
summer
, the
trend
showed a significant rise in
visitors
until 10 a.
m
. The highest peak was between 11 a.
m
. and 12
p
.
m
., with around 1500
visitors
. After 12
p.
Correct your spelling
p.m.
m
, the
trend
started decreasing gradually.
Similarly
to
summer
, the
trend
in winter
showeds
Correct your spelling
showed
shows
a significant increase from 0 to 500
visitors
at 10 a.
m
. The highest number of
visitors
was 600 people and happened between 11 a.
m
. and 12
p
.
m
. From 12
p
.
m
. to 2
p
.
m
., the
trend
started decreasing, and there was no visitor after 2
p
.
m
.
Submitted by kucinglab on

Unauthorized use and/or duplication of this material without express and written permission from this site’s author and/or owner is strictly prohibited. Excerpts and links may be used, provided that full and clear credit is given to Writing9 with appropriate and specific direction to the original content.

Sentences: Add more complex sentences.
Linking words: Add more linking words.
Vocabulary: Replace the words visitors, summer, trend, p, m with synonyms.
Vocabulary: The word "chart" was used 2 times.
Vocabulary: The word "shows" was used 2 times.
Vocabulary: The word "number of" was used 3 times.
Vocabulary: The word "trend" was used 6 times.
Vocabulary: The word "increased" was used 2 times.
Vocabulary: The word "gradually" was used 2 times.
Vocabulary: The word "significant" was used 2 times.
What to do next:
Look at other essays: