
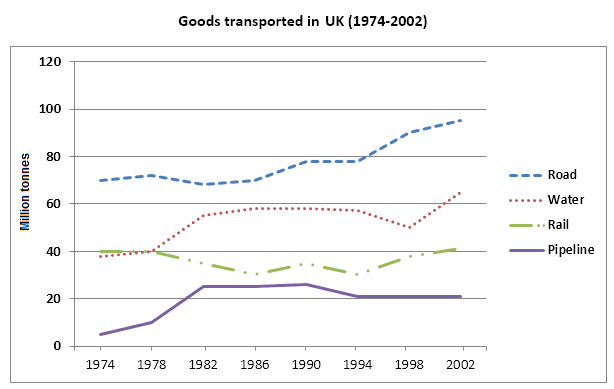
The given line graph compares four forms in terms of
goods
transported in the UK over a period of 28 Use synonyms
years
from 1974 to 2002.
Use synonyms
Overall
, it is clear from the diagram that the majority of Linking Words
goods
are carried by road Use synonyms
transportations
. Fix the agreement mistake
transportation
On the other hand
, pipeline Linking Words
transportations
had the lowest amount in the graph. Fix the agreement mistake
transportation
Moreover
, the three forms rose with some fluctuations in the time period except rail, which remained quite stable
Linking Words
To begin
with, Linking Words
Use synonyms
goods
transported Correct article usage
the goods
on
Change preposition
by
the
road figure increased moderately to approximately 80 Correct article usage
apply
million
from 1974 to 1990. Use synonyms
Then
, it continued to stay steady Linking Words
in
4 Change preposition
for
years
before increasing significantly to 95 in 2002. Regarding, Water transportation’s quantity witnessed a considerable growth by 27 units from 1978 to 1982 before the figure remained constant at approximately 68 Use synonyms
million
over the period of 12 Use synonyms
years
and reached 65 Use synonyms
million
in 2002.
Use synonyms
By contrast
, the use of rail transportation for carrying Linking Words
goods
was at the same level Use synonyms
with
water from 1974 to 1978, amounting to 40 Change preposition
as
million
. Use synonyms
Although
there were two gradual drops to 30 Linking Words
million
in 1986 and 1994, Use synonyms
this
data reached 40 Linking Words
million
in 2002. Use synonyms
Finally
, Linking Words
goods
transported by the pipeline data increased substantially from 5 to 25 Use synonyms
million
before there was a Use synonyms
leveling
off at 25 Change the spelling
levelling
million
in 12 Use synonyms
years
and reached over 20 Use synonyms
million
in 2002.Use synonyms
quynhtranhbh