
The given line chart illustrates the number of
goods
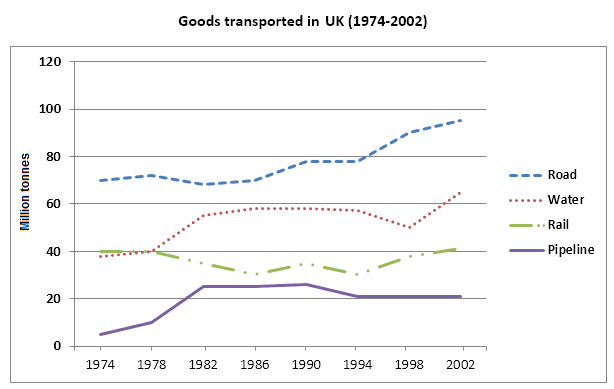
transported in the UK over a period of 28 years from 1974 to 2002 by road, water, rail and pipeline.
Use synonyms
Overall
, as can be clearly Linking Words
from
the graph that the road was the highest Verb problem
seen from
number
among Check wording
apply
four
different modes of transport. The pipeline was the smallest amount of
Correct article usage
the four
Use synonyms
goods
transported. The water and rail have the quantities at equilibrium and and calculated in million tonnes.
In Fix capitalization
Goods
term
of Fix the agreement mistake
terms
road’s
figures, the Check wording
road
value
began at 70M in 1974. There was a significant increase from 70M to 82M between 1974 and 1994. During the period from 1994 to 2002, the ratio of road climbed Use synonyms
substantialy
from 82M to 95M and Correct your spelling
substantially
gain
Verb problem
reached
the
highest Correct pronoun usage
its
value
.
Use synonyms
Additionally
, in other Linking Words
goods
Use synonyms
such
as water, the price started at 39M in 1974. And Linking Words
then
, Linking Words
this
price Linking Words
jump
from 39M to 67M in 1982. There was Replace the word
jumped
gradual
decrease Correct article usage
a gradual
drom
67M to 50M between 1982 and 1998. Over 4 years between 1998 and 2002, Correct your spelling
from
this
Linking Words
value
went up slightly from 50M to 65M. Regarding rail, the cost stood at 40M in 1974. There was Use synonyms
considerable
drop from 40M to 30M between 1974 and 1994. Correct article usage
a considerable
During from
1994 to 2002, Change preposition
From
this
cost Linking Words
growth
moderately Replace the word
grew
42M
.
The Change preposition
by 42M
last
Linking Words
goods
Use synonyms
is
pipeline, Correct subject-verb agreement
are
this
rate began at 5M in 1974. There was a significant go up from 5M to 25M between 1974 and 1994. Over 8 years between 1994 to 2002. Linking Words
This
Linking Words
value
Use synonyms
remain
unchanged and Correct subject-verb agreement
remains
gain
the least number.Correct subject-verb agreement
gains