
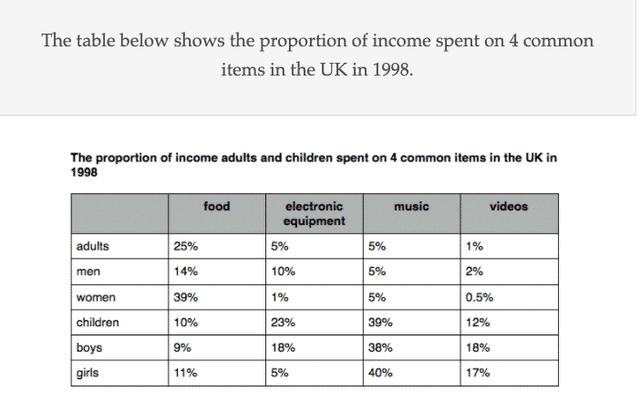
The table illustrates the
percentage
of humans who spent their salary on Use synonyms
food
, electronic equipment, music and videos in the United Kingdom in the year 1998.
Use synonyms
Overall
, adults, women and men used the highest portion of their Linking Words
income
for Use synonyms
food
purchases. Use synonyms
Whereas
, children, Linking Words
boys
and girls used significant amount for buying musical instrument or equipment. The lowest Use synonyms
percentage
spent can be seen from the table for videos.
Use synonyms
To begin
with, Women used their 39% of salary to buy Linking Words
food
. Use synonyms
While
adults and men spent 25% and 14% respectively. Linking Words
Boys
’ expense was the lowest Use synonyms
percentage
for buying Use synonyms
food
which is 9%. 23% and 18% of money was spent on electronic pieces of equipment by children and Use synonyms
boys
and Use synonyms
this
was the highest Linking Words
percentage
of Use synonyms
income
used for electronic products.
Compared to adults, children, Use synonyms
boys
and girls spent the maximum amount on music products which is 39%, 38% and 40% respectively. Video game was the lowest amount used by the given category of people. In that Use synonyms
boys
spend 18% of their Use synonyms
income
and it was the maximum Use synonyms
percentage
used. Adult only expenditure their 1% of their Use synonyms
income
on videos.Use synonyms