
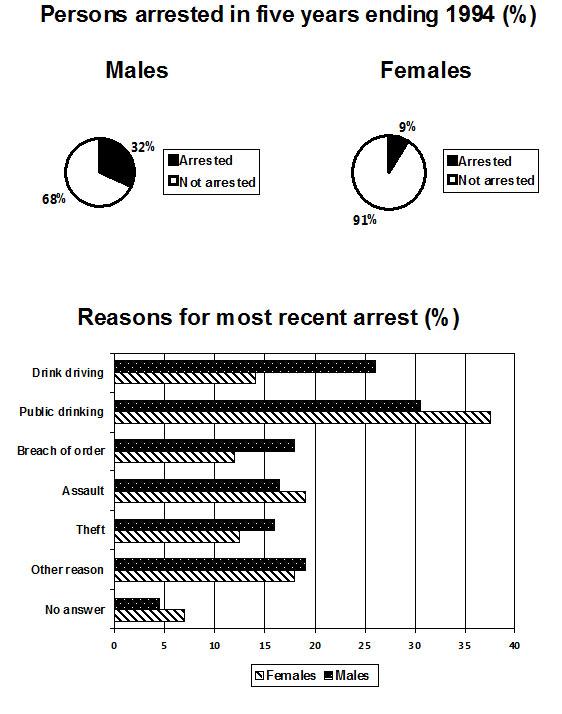
The pie charts display the
percentage
of Use synonyms
females
and males arrested between 1989 and 1994, Use synonyms
whereas
the bar chart shows, by gender, what they were arrested for and the Linking Words
percentage
of arrests for every crime. Use synonyms
Overall
, males were arrested more than Linking Words
females
, and public drinking was the most common reason for arrest for both.
Use synonyms
To begin
, the proportion of males arrested was much greater than for Linking Words
females
. 32% of them were arrested during the given period, compared to 9% for the female category. Use synonyms
Men
were twice as likely to be arrested for drunk driving than Use synonyms
females
, at slightly above 25% and just under 15%, respectively. Breach of order, theft, and other reasons were Use synonyms
also
higher for Linking Words
men
, with all the reasons between a Use synonyms
percentage
of 12% and approximately 18% for both sexes.
Notably, women experienced a higher rate of arrests for assault and public drinking. The former Use synonyms
offense
was at approximately 18%, quite similar to Change the spelling
offence
men
's Use synonyms
percentage
, and the latter, the main reason for arrests, at around 38%, roughly 7% more than Use synonyms
men
that were arrested for committing Use synonyms
this
crime. Linking Words
Moreover
, approximately 5% of women and Linking Words
men
didn't say what they were arrested for.Use synonyms