The pie chart illustrates the results of a review conducted by the university of the opinions of full-time and part-time students about services.

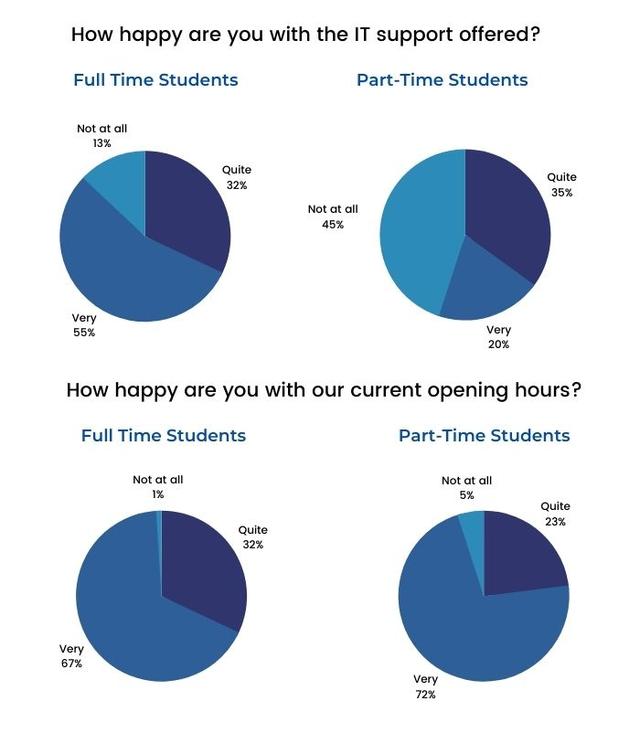
All in all, full-time
students
have higher percentages in three parts: not at all, quite happy, and very happy for the services at the university, Use synonyms
while
part-time Linking Words
students
have the lowest results in three parts for the services from the university.
Use synonyms
To begin
with, full-time Linking Words
students
have a higher percentage, accounting for 87 Use synonyms
percent
of very happy Change the spelling
per cent
students
in current opening hours, and Use synonyms
this
figure is similar for part-time Linking Words
students
at 72%. Trade utilities of part-time Use synonyms
students
accounted for more than two-fifths Use synonyms
percent
of the IT support offered, Change the spelling
per cent
although
in the same case, full-time Linking Words
students
have percentages around less than a fifth Use synonyms
percent
.
Change the spelling
per cent
On the other hand
, the lowest percentage comprised almost a quarter of part-time Linking Words
students
who were quite happy during the current opening hours, Use synonyms
whereas
full-time Linking Words
students
made up 12% of the current opening hours. Based on the data from all survey results conducted by universities regarding services, full-time Use synonyms
students
get the highest answers using three categories, Use synonyms
while
the lowest is among part-time Linking Words
students
.Use synonyms
Submitted by musa.nuwa on
Unauthorized use and/or duplication of this material without express and written permission from this site’s author and/or owner is strictly prohibited. Excerpts and links may be used, provided that full and clear credit is given to Writing9 with appropriate and specific direction to the original content.
Sentences: Add more complex sentences.
▼
Linking words: Don't use the same linking words: "while".
▼
Introduction: The introduction is missing.
▼
Introduction: Change the first sentence in the introduction.
▼
Introduction: The chart intro is missing.
▼
Introduction: The chart intro is missing.
▼
Vocabulary: Replace the words students with synonyms.
▼
Vocabulary: Only 5 basic words for charts were used.
▼
Vocabulary: The word "percentages" was used 4 times.
▼