
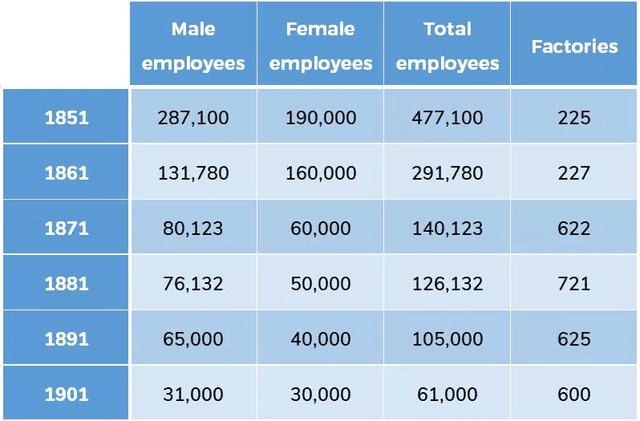
The given table illustrates how many
employees
and Use synonyms
factories
were in 2 different countries (England and Wales) over a Use synonyms
period
of 10 years (1851-1901).
Use synonyms
Overall
, what stands out from the graph is that AT the beginning of the Linking Words
period
the Use synonyms
number
of male Use synonyms
employees
was higher than females, Use synonyms
although
these categories showed a drop to A similar point by the end of the Linking Words
period
.
Looking at the details, Use synonyms
initially
, the Linking Words
number
of male and female Use synonyms
employees
was 287,100 Use synonyms
people
and 190,000 Use synonyms
people
respectively, Use synonyms
whereas
the former decreased by almost twice as it was, Linking Words
while
the latter declined to only 30000. Linking Words
Next,
all kinds of workers continued to drop until the Linking Words
period
and in 1901 finished at Use synonyms
the
similar point (30000). The total Correct article usage
a
number
of Use synonyms
employees
demonstrated a fall throughout the Use synonyms
period
, from 477100 Use synonyms
people
in 1851 to 61000 Use synonyms
people
in 1901.
Use synonyms
In contrast
, the Linking Words
number
of Use synonyms
factories
started at 225 in 1851, which continued to rise until 1881 to 721 Use synonyms
factories
, before dropping to 600 Use synonyms
factories
by the end of the Use synonyms
period
.Use synonyms