
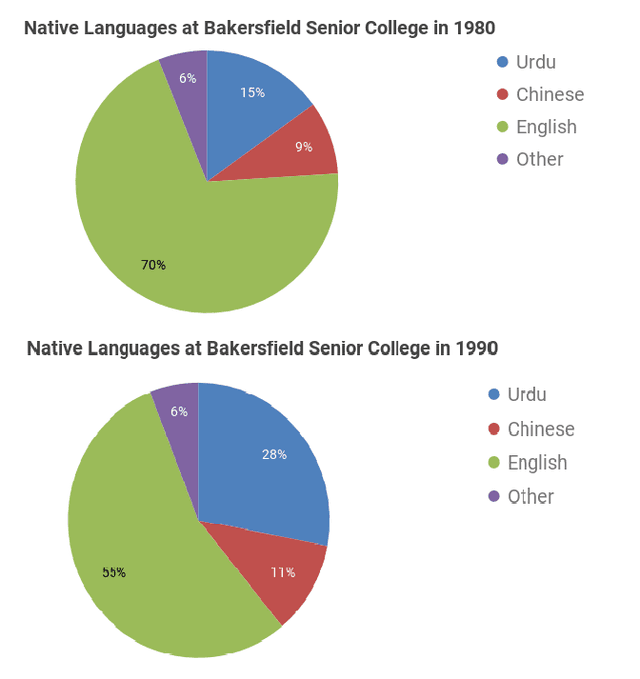
The pie charts depict various native languages spoken by youth at Bakersfield Senior College in two different years, which are 1980 and 1990. Substantially,
English
takes the biggest percentage out of the other languages in both decades, Use synonyms
in addition
, the most significant growth has Urdu.
It is shown, that Chinese slightly increased through 10 years from 9% to 11%, Linking Words
besides
it supplanted Linking Words
English
. Use synonyms
Moreover
, Urdu Linking Words
also
Linking Words
,
took an enormous part from Remove the comma
apply
English
. It doubled in percentage, which was 15% in 1980, and became roughly 30% in the next given year. It led to a dramatic plunge in Use synonyms
English
, which was almost 20%, and became approximately half of the whole chart, even though it took merely under 3/4 in 1980. Use synonyms
Nevertheless
, other tongues did not change at all and were static, which was 6% during the decade.
Linking Words
To sum up
, all dialects moderately increased, which led to the displacement of the main spoken language.Linking Words