
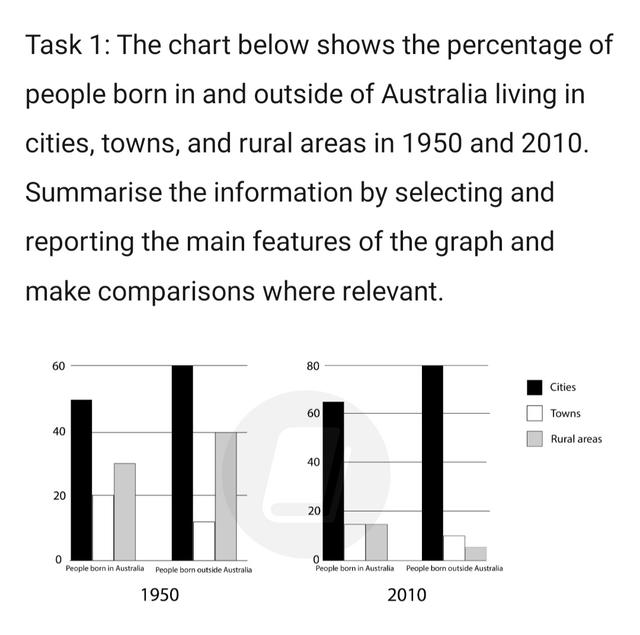
The given charts illustrate the
amount
of Use synonyms
Australian
individuals were born Use synonyms
while
who Linking Words
were
born in Change the verb form
was
except
Change preposition
apply
Australia
living in three different types of Use synonyms
area
(urban, rural and town) between 1995 and 2010.
Fix the agreement mistake
areas
Overall
, it can be seen thatLinking Words
,
the people who Remove the comma
apply
born
outside in city had Add a missing verb
were born
most
Correct article usage
the most
amount
in Use synonyms
both
Use synonyms
year
. Change to a plural noun
years
Additionally
, the Linking Words
Use synonyms
Australian
individual who Correct quantifier usage
number of Australian
born
in their own country' numbers were highest in Add a missing verb
were born
Add an article
the city
a city
city
in Fix the agreement mistake
cities
both
Use synonyms
year
(1995 and 2010).
Fix the agreement mistake
years
Firstly
, in 1995, the Linking Words
amount
of borning in Use synonyms
city
had almost 50, and Add an article
the city
these
number increased Correct determiner usage
this
repeatly
in 2010. The number of borning in Correct your spelling
repeatedly
Australian
town and outside Use synonyms
Australia
towns Use synonyms
had
20 and around 10 respectively in 1995. The Verb problem
was
amount
of borning in towns decreased until Use synonyms
the
2010. Change the article
apply
Linking Words
Furthermore
Add a comma
Furthermore,
Australian
citizens who Use synonyms
born
in their rural areas had nearly 30 in 1995, and Add a missing verb
were born
this
value sharply diminished in 2010. The Linking Words
least
value in the given bar chart is the people who Correct word choice
lowest
born
Add a missing verb
were born
in
outside Change preposition
apply
Australia
was Use synonyms
approximatelly
5 in 2010.
In conclusion, Correct your spelling
approximately
Australian
citizens Use synonyms
borning
in cities in Verb problem
living
both
Use synonyms
year
and Change to a plural noun
years
both
Use synonyms
area
(Fix the agreement mistake
areas
Australia
and outside Use synonyms
Australia
) had boosted Use synonyms
in
during given times.Change preposition
apply