
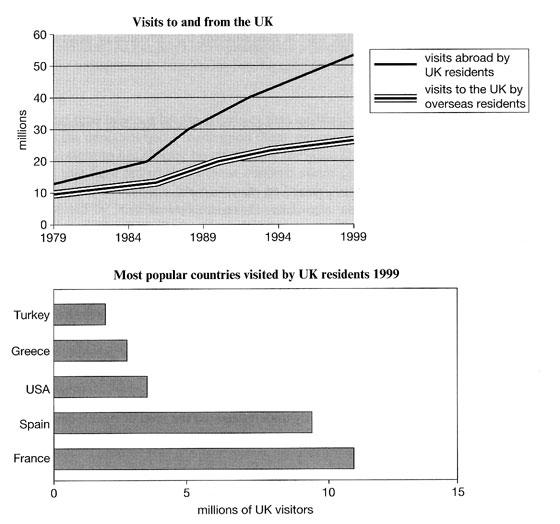
The line chart provides information about
visitors
who came to the Use synonyms
UK
from outside from 1979 to 1999, Use synonyms
while
the bar chart illustrates the five countries (Turkey, Greece, the USA, Spain, and France) tourists to the Linking Words
UK
in 1999.
Use synonyms
Overall
, people who visit the Linking Words
UK
are overseas residents, and people who are abroad in the Use synonyms
UK
experience an upward trend throughout the period. France was the country to visit the Use synonyms
UK
, Use synonyms
while
Turkey was the lowliest country visit to the Linking Words
UK
.
The number r Use synonyms
visitors
in 1979 was 10 Use synonyms
million
who came abroad from the Use synonyms
UK
, or who visited overseas residents in 1999. the Use synonyms
UK
experienced an upward trend of Use synonyms
visitors
arriving abroad the Use synonyms
UK
under 39 Use synonyms
million
and overseas residents above 50 Use synonyms
million
.
We can see in Use synonyms
this
bar chart that France is the most country who visited the d Linking Words
UK
above 6 Use synonyms
million
Use synonyms
while
Turkey's lowest number of Linking Words
visitors
arrived under 5 Use synonyms
million
.Use synonyms