
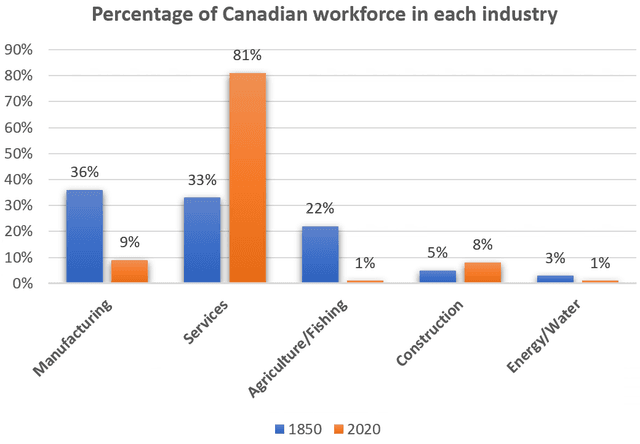
The given bar chart illustrates the five major industries in Canada's
workforces
in the years of 1850 and 2020 in percentage.
Fix the agreement mistake
workforce
Overall
, it can be seen that Linking Words
at the end
of the period, the majority of the workforce was recorded as the services industry Linking Words
while
the energy and water industries' workforces were the very least amount for both given years.
In the year 1850, manufacturing Linking Words
workers
' contribution was high around 36% Use synonyms
also
second contribution from the services workforce was about 33% and agriculture or fishing Linking Words
workers
recorded 22% in Use synonyms
this
period. Linking Words
However
, the very least amount of employers accounted for energy and construction about 3% and 5% respectively.
Linking Words
On the other hand
, in the year 2020 most influencing industry in Canada was services which was recorded as the highest among them about 82%. But other sectors made the very least contribution around 9% from manufacturing and 8% from construction Linking Words
workers
. Use synonyms
However
, Linking Words
workers
from agriculture and energy recorded the same amount of 1% which was the lowest workforce found Use synonyms
at the end
of the period.Linking Words