The charts below show the percentage of water used for different purposes in six areas of the world. Summarise the information by selecting and reporting the main features, and make comparisons where relevant. Write at least 150 words. The charts below show the percentage of water used for different purposes in six areas of the world. Summarise the information by selecting and reporting the main features, and make comparisons where relevant. Write at least 150 words.

The charts below show the percentage of water used for different purposes in

six areas of the world.

Summarise the information by selecting and reporting the main features, and

make comparisons where relevant.

Write at least 150 words.

The charts below show the percentage of water used for different purposes in

six areas of the world.

Summarise the information by selecting and reporting the main features, and

make comparisons where relevant.

Write at least 150 words.
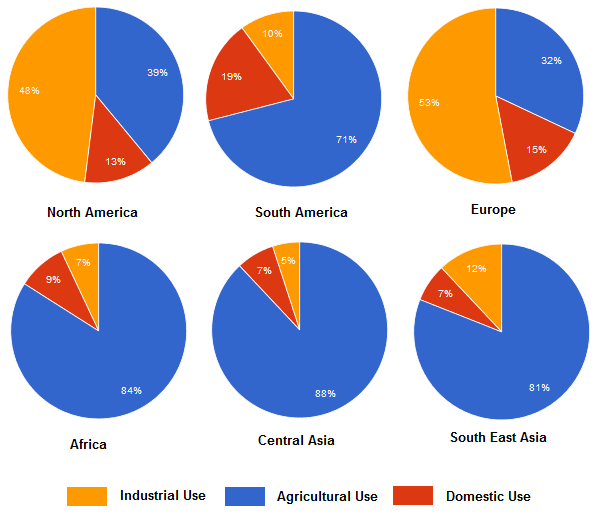
The given pie charts illustrate the proportion of drinks used for three different topics which are inside six realms. As a start,
it is clear that
the countries which maintain their growth utilize water for industry. We can analyze that in North America’s usage 48% rates -roughly half of all chart-
as well as
usage rate of Europen lands. It is upward of the other categories with 53% . The highest option for a drink in the other four realms is agricultural handling by a large margin. The percentage of liquid in Africa , Central
Asia
and South East
Asia
have the vast majority of the whole chart
together with
South America's rate of
using
Replace the word
use
show examples
above 70% too.
Moreover
Add a comma
Moreover,
show examples
the other topics are non–existent virtually. Intercalarily, the chapter on Domestic use covers a few areas in all of them, the highest rate is in South America. Central
Asia
and South East
Asia
purchased
an identical proportions
Correct the article-noun agreement
identical proportions
an identical proportion
show examples
of the value of drinks at 7%.
To sum up
, Undeveloped realms seem to have failed in the industry,
therefore
,agricultural benefit dominates a large area and we analyze that It is the industrial area that improves so as to countries
thus
we can analyze
this
argument with pie charts can clearly be seen charts of supra.
Submitted by ezgi.maide.213 on

Unauthorized use and/or duplication of this material without express and written permission from this site’s author and/or owner is strictly prohibited. Excerpts and links may be used, provided that full and clear credit is given to Writing9 with appropriate and specific direction to the original content.

Vocabulary: Replace the words asia with synonyms.
Vocabulary: The word "charts" was used 5 times.
Vocabulary: The word "proportion" was used 2 times.
Topic Vocabulary:
  • water consumption
  • agricultural, industrial, domestic
  • usage patterns
  • developed vs developing regions
  • irrigation systems
  • climate factors
  • percentage breakdown
  • water management
  • sustainability
  • residential water use
  • efficiency
  • charts comparison
  • water-intensive
  • water scarcity
  • resource allocation
  • desalination
What to do next:
Look at other essays: