
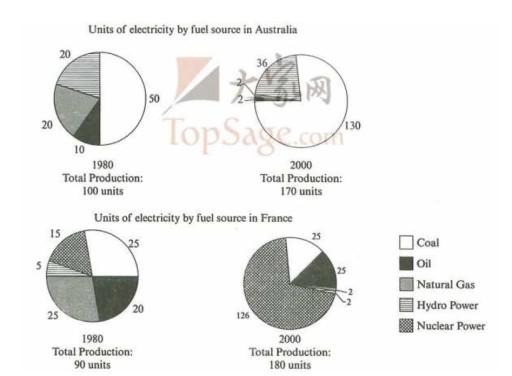
The given pie charts illustrate how much electricity was produced from various fuel sources in Australia and France in the two years 1980 and 2000.
Overall
, Australia's main source of electricity came from coal which is more than half of the total Linking Words
units
Use synonyms
while
France's production of electricity from nuclear power plants increased Linking Words
at the end
of the period than the previous year. Linking Words
Although
, both countries total production of energy Linking Words
units
significantly increased Use synonyms
at the end
of the period
It can be seen that coal was the main source of energy produced in Australia. At the beginning of the period, almost half a portion of the power generated from coal and it is increased to more than half in the year 2000, at 50 Linking Words
units
from 130 Use synonyms
units
. Use synonyms
However
, other sources of energy largely reduced in 2000 , at 36 Linking Words
units
from hydropower and only 2 Use synonyms
units
from each oil and gas.
Use synonyms
However
, in France, Linking Words
total
production of power almost doubled from 90 Correct article usage
the total
units
to 180 Use synonyms
units
in 2000. The largest amount of Use synonyms
units
producedUse synonyms