
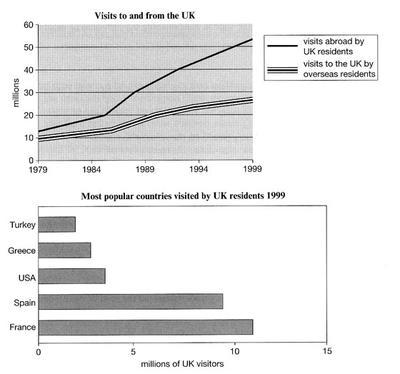
The graphs demonstrate how many visits were made to Britain between 1979 and 1990,
in addition
to an evaluation of the most visited countries by British dwellers in the year 1999.
Linking Words
Overall
, Linking Words
it is clear that
Linking Words
although
the number of people paying a visit to foreign countries has risen considerably, that of the UK witnessed a slight increase. Linking Words
Moreover
, Turkey and France were the least and the most popular regions among British residents, respectively.
Focusing on the first graph, it is noticeable that in the first seven years, the trends of visits to and from the United Kingdom shared a similar trend with the latter one being of more intensity by a margin of 5 Linking Words
million
. Use synonyms
Next,
from 1986 to 1999, moving from the UK accumulated from 20 to around 55 Linking Words
million
. Use synonyms
However
, the second trend rose to less than 5 Linking Words
million
, reaching approximately 25 Use synonyms
million
people.
Moving on to the pUse synonyms