
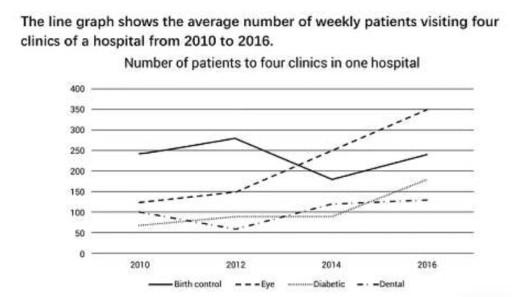
the line
gragh
gives us Correct your spelling
graph
informatione
about the average Correct your spelling
information
number
of patients who have visitedUse synonyms
bith
control ,eye ,diabetic and dental Correct your spelling
birth
clinics
between 2010 and 2016 , Use synonyms
overall
it can be seen that the Linking Words
amount
of Change the quantifier
number
visitores
have been increased over the period ,significantly for eyes Correct your spelling
visitors
clinics
,Use synonyms
however
Linking Words
Add the comma(s)
,
bith
control patients remained stable .
refers to the eye and Correct your spelling
birth
Diabestic
Correct your spelling
Diabetic
clinics
which the Use synonyms
number
of sick peopleUse synonyms
more
visited for ,
eye hospital stood at around 110 weeklyCorrect quantifier usage
apply
visitor
in 2010,Change to a plural noun
visitors
although
Linking Words
this
Linking Words
number
was dramatic rise to 350 in 2016 , Use synonyms
also
Linking Words
Diabestic
clinic Visitors in 2010 saw reached steadily from about 55 to 100 in 2014 , but Correct your spelling
Diabetic
this
amount Linking Words
was increase
quickly to over 155 visitors .
regards to Change the verb form
was increased
other clinic
Change the wording
another clinic
other clinics
such
as Birth Linking Words
conrtol
and dental , Dental Correct your spelling
control
clinics
Use synonyms
have
started with 100 patients during the period 2014 and 2016 the amount of visitors increased gradually . over the period the Unnecessary verb
apply
number
of people who have visited Birth control remained unchangedUse synonyms