
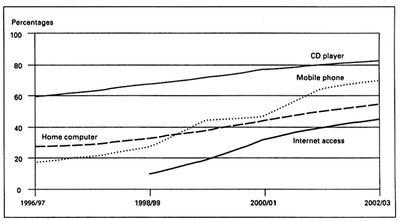
The graphic contains information about modern technology owned by UK citizens over seven years. It depicts the correlation between domestic homes having access to devices and its growth.
CD players were popular in UK society, as three-fifths possessed
this
by 1996. Linking Words
This
trend continued increasing steadily, Linking Words
hence
, 20% more of the population had acquired one by 2003, growing its number to an outstanding number of more than three-quarters.
Mobile phones, Linking Words
on the other hand
, were not predilected among the nation as less than a fifth had it around 1997. Linking Words
Although
cell phones experienced a slow increment from 1996 to 1998, these devices boasted a huge rise of almost half of their previous numbers. By 2003, said devices had reached more than 60% of users.
Undoubtedly, internet access boosted home computer and mobile phone ownership, as when it became public in 1998, both products were highly bought, Linking Words
product
of the internet outbreak.Add an article
a product
the product