
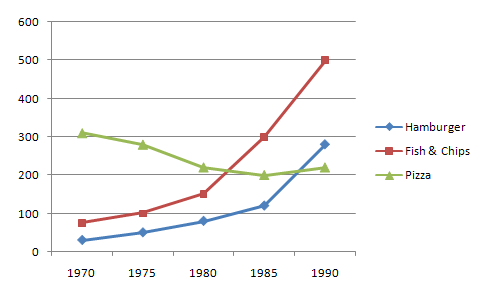
The line chart gives information about the consumption trends of fast foods in the UK in two decades from 1970 to 1990.
Overall
, the data shows that fish & chips and Linking Words
Use synonyms
hamburger
significantly increased in that time. Fix the agreement mistake
hamburgers
In contrast
, pizza had a slight decrease.
In the 1970s, the consumption of pizza was the highest at 300 in the United Kingdom. Linking Words
However
, Linking Words
Use synonyms
hamburger
and fish & Fix the agreement mistake
hamburgers
chips
were under 100 at that time. In the following years, the need for pizza minimally jumped down to 200 in 1985, Correct word choice
and chips
then
improved slightly to only 210 in 1990. Linking Words
On the other hand
, the consumption of fish and chips slowly grew in the next years, Linking Words
then
Linking Words
finally
dramatically climbed to 500 in 1990 which was its peak number. Linking Words
Similarly
, it happened to Linking Words
Use synonyms
hamburger
which gradually rose to 110 in 1985. Fix the agreement mistake
hamburgers
Moreover
, the need for Linking Words
Use synonyms
hamburger
by UK citizens had considerable growth in 1990 with nearly 300.Fix the agreement mistake
hamburgers