
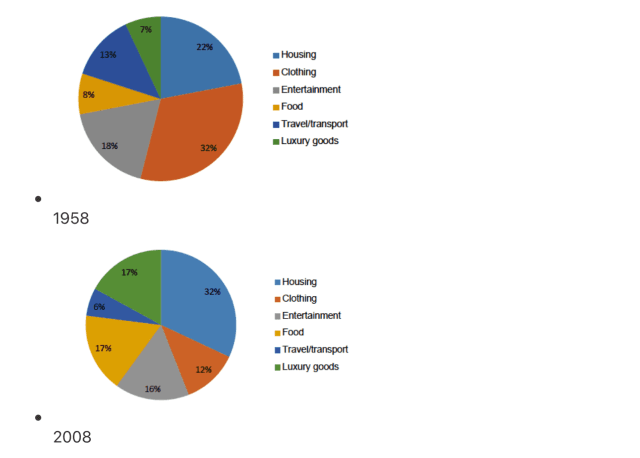
These pie charts depict the expenditure patterns of Europeans on various commodities during two distinct periods.
Overall
, Linking Words
while
the majority of spending is directed towards essential categories Linking Words
such
as housing, food, and transportation, a contrasting trend is evident in leisure-related expenses. Notably, Linking Words
two
categories saw minimal fluctuations over the 50-year span.
In the essential commodities category, food constituted the highest expenditure at 32% in 1958, followed by housing and transportation at 22% and 8%, respectively. Correct article usage
the two
However
, Linking Words
this
allocation witnessed a significant decline of 20%, rendering it less prominent within Linking Words
this
segment. Linking Words
Conversely
, housing and transportation experienced growths of 10% and 9% between 1958 and 2008.
In 2008, within the entertainment expenditure category, luxury goods accounted for the smallest portion at 7%. Notably, both entertainment and clothing witnessed reductions of 7% and 2%, respectively, during the same period. Remarkably, luxury goods witnessed a surge from 7% to 17%, emerging as the most Linking Words
favored
commodity in the entertainment segment.Change the spelling
favoured