
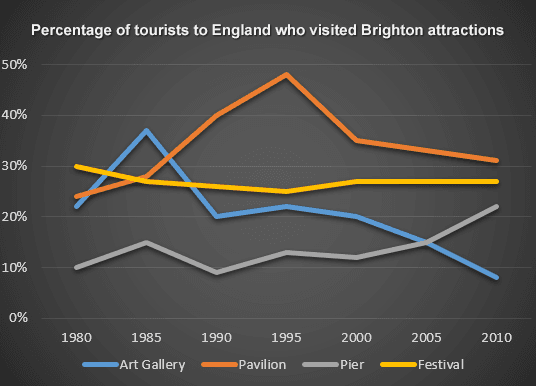
The given line graph shows the percentage of visitors to Brighton Attractions in England between 1980 and 2010. The units were measured in percentage and divided
in
four attractions, which are Change preposition
into
Art
gallery, Pavilion, Pier and Festival.
Correct article usage
the Art
Overall
, it can be clearly seen that Linking Words
Pavilion
experienced the highest peak Correct article usage
the Pavilion
whereas
Art Gallery visitors dropped in the Linking Words
last
year.
In terms of Art Gallery Linking Words
tourist
, started at just Fix the agreement mistake
tourists
abouve
20% in 1980. In the following year, the percentage rocketed to approximately 38% in 1985 before Correct your spelling
above
encoutering
a significant drop in 1990 at Correct your spelling
encountering
pricesely
20% and gradually decreased until reached the lowest point at 8% in 2010. Meanwhile, the Pavilion Correct your spelling
precisely
intilally
Correct your spelling
initially
at
23% in 1980 and hit Add a missing verb
was at
the
peak at Change the word
its
almost
doubled number in 1995. Add an article
the almost
an almost
However
, the trend Linking Words
then
considerably Linking Words
falled
5 years later and went down moderately Correct your spelling
fell
reached
30% in 2010.
Regarding the Pier, Wrong verb form
reaching
begin
at exactly 10% Wrong verb form
began
at
1980 and experienced a Change preposition
in
flucuative
trend between 1985 and 2000. After that, the figure increased gradually and hit at just 20% in 2010. Correct your spelling
fluctuating
fluctuation
Lastly
, the Festival stood at 30% as the highest proportion compared with Linking Words
another attractions
in 1980 and the number Replace the adjective
another attraction
other attractions
relatively
stable until 2010, at 28%.Add a missing verb
was relatively