
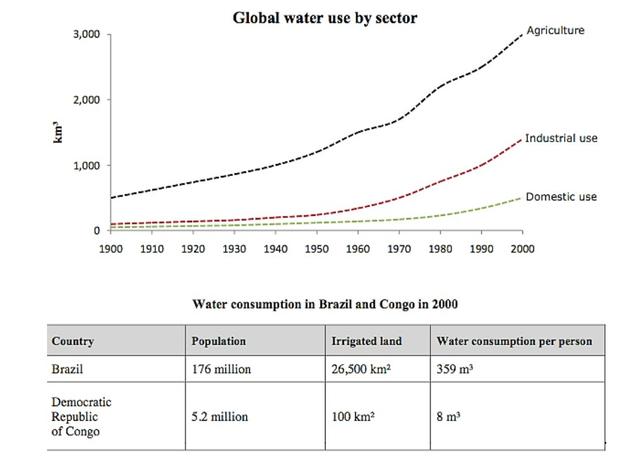
The charts compare the worldwide
water
consumed in three different sectors over a 100-year period, and Use synonyms
water
use in Use synonyms
Brazil
and the Democratic Republic of Use synonyms
Congo
in 2000.
Use synonyms
It is clear that
the Linking Words
overall
Linking Words
water
consumption experienced a considerable rise during the period shown in the graph, and that agriculture accounted for the largest proportion of Use synonyms
water
used. Use synonyms
Also
, the use of Linking Words
water
in Use synonyms
Congo
is nowhere near as high as it is in Use synonyms
Brazil
.
In 1900, the highest global Use synonyms
water
consumption was related to agriculture at about 500 km2, Use synonyms
while
industry and domestic sectors were responsible for nearly 100 and 50 km2 of used Linking Words
water
. Use synonyms
Following
Linking Words
this
, the figures for housing and industrial categories remained stable until 1950, and by 2000, they had risen strikingly, reaching 500 km2 and just under 1400 km2, respectively. Regarding the agriculture sector, it saw the most significant growth trend by almost 2500 km2.
In 2000, each Brazilian consumed 359 m3; Linking Words
however
, the residents of Linking Words
Congo
used only 8 m3, which could be justified by their irrigated lands, which is 265 times larger in Use synonyms
Brazil
than in Use synonyms
Congo
. Use synonyms
Also
, it is noteworthy that the total number of inhabitants in Linking Words
Brazil
was 176 million, but the population of Use synonyms
Congo
was not nearly as high at 5.2 million.Use synonyms