
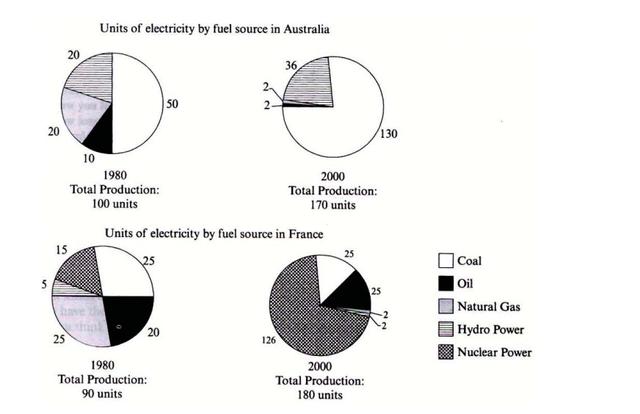
The pie charts illustrate measures of
electricity
Use synonyms
production
by various fuel sources in two different countries, Australia and France, between 1980 and 2000.
Use synonyms
According to
the given data, the most Linking Words
amount
of Use synonyms
electricity
manufacturing belonged to coal and hydropower during these years. The other sources were used to Use synonyms
power
manufacturing in the low Use synonyms
amount
respectively and the volume of these dropped a lot in the end. Use synonyms
In addition
, Linking Words
this
nation had not benefited from nuclear Linking Words
power
at all.
In France, we are witnessing that the usage Use synonyms
amount
of coal and oil has been stable approximately in Use synonyms
this
period. Linking Words
However
, Linking Words
this
country even made Linking Words
electricity
from nuclear energy. The usage Use synonyms
amount
of it has increased a lot Use synonyms
at the end
of the period. The rest sources were located in the low position respectively. The Linking Words
power
Use synonyms
production
by other energies has decreased significantly.
Use synonyms
To sum up
, Australia has the most use of coal for Linking Words
electricity
Use synonyms
production
compared to the others. Use synonyms
However
, France had a suitable benefit from the nuclear Linking Words
power
source to Use synonyms
electricity
Use synonyms
production
.Use synonyms