
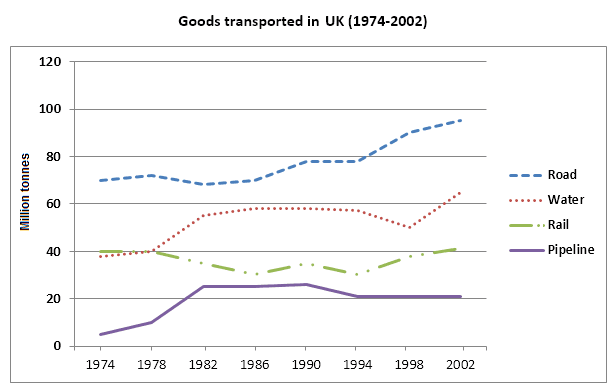
The line graph provides information about the total number of products shipped in the United Kingdom in four distinct routes from 1974 to 2002. The unit is measured in
million
Use synonyms
tonnes
.
Use synonyms
Overall
, it can be seen from the graph that the transport of materials by road was high not only at the onset but Linking Words
also
Linking Words
at the end
of the year. Both routes of shipping experienced a different trend throughout the year. Linking Words
While
water and Rail transportation were quite similar Linking Words
initially
, rail surpassed it Linking Words
at the end
of the year with more products.
Linking Words
To begin
with, exporting of goods by road stood at just above 60 Linking Words
million
Use synonyms
tonnes
in 1974, Use synonyms
however
, the figure decreased gradually to approximately 80 in 20 years until it skyrocketed to almost 100 Linking Words
million
Use synonyms
tonnes
in the Use synonyms
last
period.
Linking Words
By contrast
, Linking Words
although
aquatic Linking Words
as well as
export of materials was almost similar in 1974, 40 Linking Words
million
Use synonyms
tonnes
, Use synonyms
nonetheless
marine mode of exporting showed many significant changes. It increased gradually in the next 2 years by almost 58 and plateaued in the next 10 years. Linking Words
Nevertheless
, rail did not show significant improvements, in fact, it fluctuated from 1978 to 1998. Surprisingly, the pipeline did not export any materials at the onset Linking Words
nevertheless
it recorded a sharp increase to about 25 Linking Words
million
Use synonyms
tonnes
in 1982 and remained relatively stable from 1982 to 1990.Use synonyms