
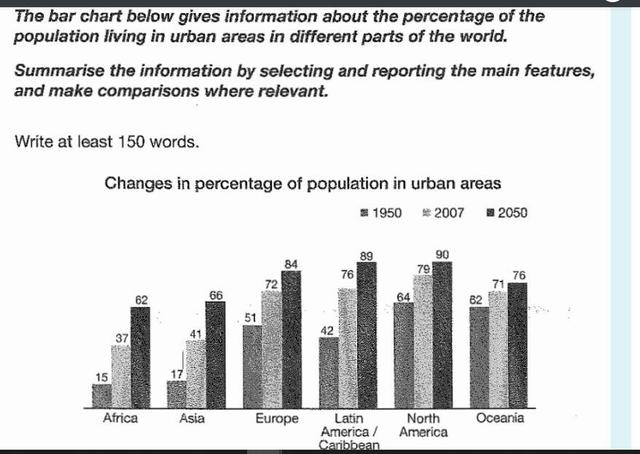
The chart depicts people living in five different countries from 1950 to 2007 and predicts the population in 2030.
Overall
, Linking Words
it is clear that
there is a considerable increase in every urban area, and the most growth is in Latin Linking Words
America
and the least is in North Use synonyms
America
.
At the beginning of the period, residents living in North Use synonyms
America
had the highest rate and beyond the world, which was around 64%, Use synonyms
whereas
the lowest percentage was 15% in Africa. The rate of Europeans exceeded 50%. After 57 years, the percentage of individuals living in Latin Linking Words
America
rose from 34% to 76%, which was more than in Africa, Asia and Europe.
Use synonyms
In addition
, North Linking Words
America
is forecasted to reach a peak at 87% in 2030, and Latin Use synonyms
America
, Europe, Africa and Asia will be above 50%, which will be 84%, 78%, 51% and 54% respectively. Use synonyms
Moreover
, the percentage of the world's people totally increase by 31% between 1950 and 2030.Linking Words