
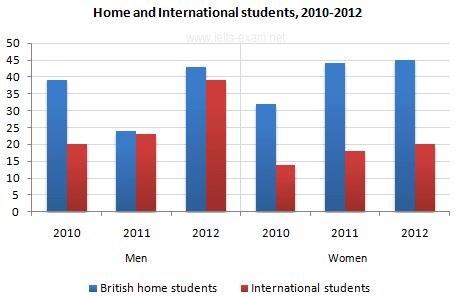
The chart illustrates how many Home and International students at a British college were learning Computer Science from 2010 to 2012.
Overall
, it can be seen that there were more locals than foreigners, both male and female. Linking Words
However
, the number of the British men had fluctuated throughout the period.
In the beginning period, the number of indigenous men in computer major was almost 40, Linking Words
then
it plunged, reaching under 25 in 2011. One year later, in 2012, they had peaked at about 43, being the highest total local students among males. Linking Words
On the other hand
, during 2010 and 2012, people who came from outside were always fewer than inside but had increased significantly from 20 to about 38.
The female had a slightly different trend. At the university, they had about 32 women in 2010. It rose considerably between 49 to 50 until 2012. Linking Words
Moreover
, the extraneous women had no more than 20, in comparison with those men during three periods.Linking Words