The chart shows British Emigration to selected destinations between 2004 and 2007. Write a report for a university, lecturer describing the information shown below. Summarise the information by selecting and reporting the main features and make comparisons where relevant.

The chart shows British Emigration to selected destinations between 2004 and 2007.

Write a report for a university, lecturer describing the information shown below.

Summarise the information by selecting and reporting the main features and make comparisons where relevant.
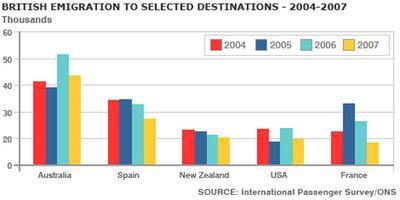
The bar chart provides information concerning five destinations of British people between 2004 and 2007. The data can be divided into two groups, namely the number that experienced an upward trend and a downward trend. It can be clearly seen that the number of British immigrants in Australia was the highest among
five
Correct article usage
the five
show examples
countries,
while
that of New Zealand stood
last
. Spain and New Zealand experienced drops, but Australia,
USA
Correct article usage
the USA
show examples
, and France
which
Correct pronoun usage
apply
show examples
mainly showed fluctuations.
To begin
, Spain and New Zealand
initially
stood at 35,000 and 22,000 in 2004 before a steady fall until 2007 when
it
Correct pronoun usage
they
show examples
reached about 28,000 and 20,000. Moving on to the figures for Australia, for
USA
Correct article usage
the USA
show examples
, and for France in 2004, the number remained at 42,000, 24,000, and 22,000 respectively. In 2005, the first two slightly decreased to about 39,000 and 19,000, but the latter dramatically increased to 32,000. After that, the figures experienced a noticeable rise and a marked drop between 2006 and 2007.
Submitted by nine318 on

Unauthorized use and/or duplication of this material without express and written permission from this site’s author and/or owner is strictly prohibited. Excerpts and links may be used, provided that full and clear credit is given to Writing9 with appropriate and specific direction to the original content.

Vocabulary: Rephrase the word "information" in your introduction.
Vocabulary: The word "figures" was used 2 times.
Vocabulary: The word "trend" was used 2 times.
Vocabulary: The word "drops" was used 2 times.
Vocabulary: The word "stood" was used 2 times.
Vocabulary: The word "about" was used 2 times.
What to do next:
Look at other essays: