
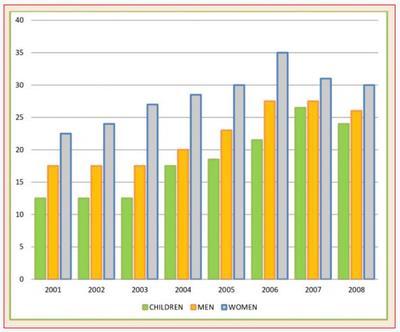
The charts
depicts
the Change the verb form
depict
rasio
of Correct your spelling
ratio
fruits
and Use synonyms
Use synonyms
vegetables
consumption for Change the noun form
vegetable
children
, Use synonyms
men
and Use synonyms
women
in the UK per day from 2001 to 2008. Use synonyms
Women
were the most Use synonyms
concious
Correct your spelling
conscious
for
dietary nutrition Change preposition
about
with
consuming the highest rate of Change preposition
apply
vegetables
and Use synonyms
fruits
Use synonyms
while
Linking Words
children
were the least Use synonyms
eater
Fix the agreement mistake
eaters
for
Change preposition
of
the
healthier diet between 2001 and 2008.
Correct article usage
a
At
the beginning, it started with the lowest data Change the preposition
In
comparing
to the following years until 2008 from any people who consumed Wrong verb form
compared
fruits
and Use synonyms
vegetables
. It gradually increased until it reached its peak in 2006 Use synonyms
by
35 Change preposition
with
Use synonyms
percent
for Change the spelling
per cent
female
and 27 Fix the agreement mistake
females
Use synonyms
percent
for Change the spelling
per cent
male
. The Fix the agreement mistake
males
children
experienced the highest rate Use synonyms
for
healthy Change preposition
of
dietary
in the next year with 26 Replace the word
diet
Use synonyms
percent
.
After its vivid top in 2006, the data experienced a slight decrease for the next 2 years until 2008. The Change the spelling
per cent
last
2 years experienced low disparity for Linking Words
women
, Use synonyms
men
and Use synonyms
children
Use synonyms
for
consuming Change preposition
in
fruits
and Use synonyms
vegetables
. It was only around 1 to 4 Use synonyms
Use synonyms
percent
differences between them.
Change the spelling
per cent
Overall
, Linking Words
Men
and Use synonyms
children
Use synonyms
were remain
unchanged from 2001 to 2003 with 13 Change the verb form
remained
Use synonyms
percent
for offspring and 17 Change the spelling
per cent
Use synonyms
percent
for Change the spelling
per cent
male
. Fix the agreement mistake
males
The
little difference happened in 2007 and 2008 Correct article usage
A
where
they Correct word choice
when
nearly
positioned in the same ratio. Add a missing verb
were nearly
Men
and Use synonyms
children
were gradually improved more for recommended consumption Use synonyms
while
Linking Words
women
were started in a high position but increased slowly.Use synonyms