
The
given
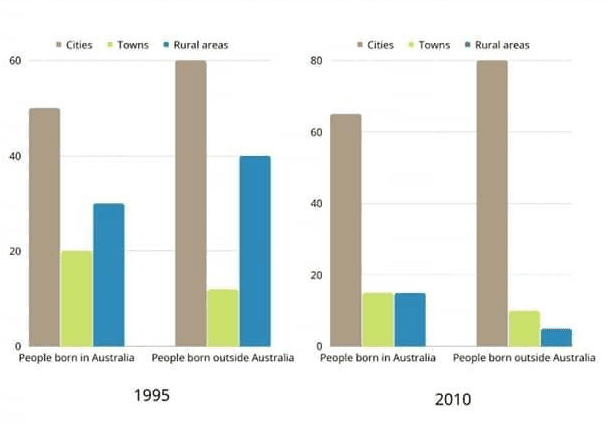
bar graphs depict information about the comparison of Verb problem
apply
Use synonyms
number
of Change the article
a number
the number
people
Use synonyms
originally
were born inside and outside Correct pronoun usage
who originally
Australia
in three different Use synonyms
area
of the country including urban, rural and town in 1995 and 2010. The data is presented by Change to a plural noun
areas
percentage
of Add an article
the percentage
a percentage
people
described in different Use synonyms
color
of the bars based on three sites of the country.
By and large, it was ubiquitous that the inhabitants Fix the agreement mistake
colors
lived
in the city had the highest Correct pronoun usage
who lived
percentation
Correct your spelling
percentage
in
Change preposition
of
both was
born in Verb problem
people
Australia
or Use synonyms
outsite
Correct your spelling
outside
Australia
over Use synonyms
the
period of time. Meanwhile, the lowest Correct article usage
a
number
came from Use synonyms
people
Use synonyms
lived
in towns in both Correct pronoun usage
who lived
period
of time.
Turning to the statistical data, Change to a plural noun
periods
people
were born Use synonyms
ousite
Correct your spelling
in
Australia
and lived in the city hold the highest Use synonyms
number
Use synonyms
accounted
for 60% in 1995 and increased Wrong verb form
accounting
two
tenths in 2010. Correct your spelling
to
Likewise
, Linking Words
people
from cities who were born inside the country Use synonyms
also
had a large proportion between two years Linking Words
meassured
for approximately a half Correct your spelling
measured
Use synonyms
percent
in 1995 and had a small growth in 2010, Change the spelling
per cent
ammounting
for just over one-sixth Correct your spelling
amounting
am mounting
Use synonyms
percent
.
Turning to the contrast, Change the spelling
per cent
people
in rural areas who were born Use synonyms
outsite
Correct your spelling
outside
Australia
achieved a huge presentation in 1995 Use synonyms
accounted
for forty Wrong verb form
accounting
Use synonyms
percent
, but it Change the spelling
per cent
was
dramatically decreased in 2010 Unnecessary verb
apply
for
under 20 Change preposition
to
Use synonyms
percent
. Change the spelling
per cent
Similarly
, the other interesting trend from Linking Words
people
in towns who were born Use synonyms
insite
Correct your spelling
inside
Australia
Use synonyms
hold
the largest Change the verb form
holds
number
in 1995 but Use synonyms
fall
Wrong verb form
fell
sligthly
in 2010.Correct your spelling
slightly