The chart below shows the results of a survey about people's coffee and tea buying and drinking habits in five autralia cities. Summarise the information by selecting and reporting the main features, and make comparisons where relevant.

The chart below shows the results of a survey about people's coffee and tea buying and drinking habits in five autralia cities.

Summarise the information by selecting and reporting the main features, and make comparisons where relevant.
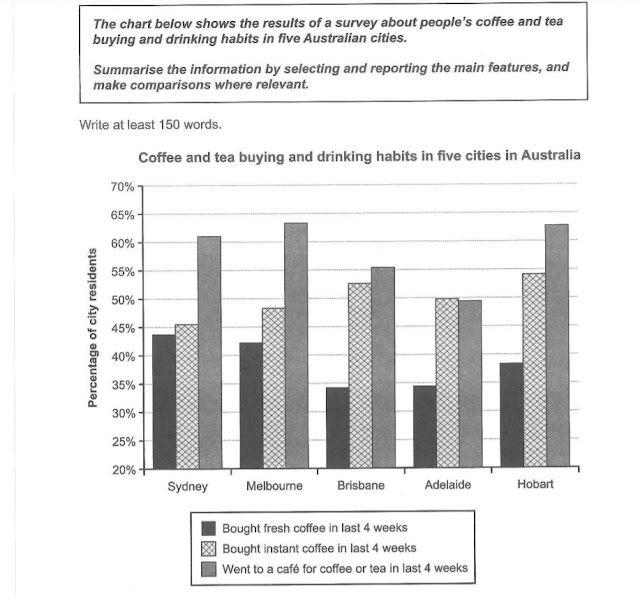
The given data shows
of
Correct article usage
a of
show examples
comparison the
habit
Fix the agreement mistake
habits
show examples
of people drinking fresh
coffee
,
instant
Correct word choice
and instant
show examples
coffee
and
went
Wrong verb form
going
show examples
to
cafe
Add an article
a cafe
the cafe
show examples
for drinking
coffee
or tea in the
last
month in five
cities
in Australia which are Sydney, Melbourne, Brisbane,
Adelaide
and Hobart. In general, going to the
cafe
was the
most
Correct quantifier usage
apply
show examples
favourite in
four
Correct article usage
the four
show examples
cities
and
consume
Wrong verb form
consuming
show examples
fresh
coffee
being
Wrong verb form
was
show examples
the
last
choice in all areas.  Melbourne and Hobart became the
city
Fix the agreement mistake
cities
show examples
of
Change preposition
with
show examples
the highest population went to the
cafe
and
then
followed by Sidney. These three
cities
have figures
more
Change preposition
of more
show examples
than sixty per cent.
Adelaide
was the city with
lowest
Change the article
the lowest
show examples
percentage of
cafe
lovers. Bought instant
coffee
was the middle of
consument
Correct your spelling
consumption
in all
cities
unless
Change preposition
except
show examples
Adelaide
,
that
Correct word choice
where
show examples
instant
coffee
was
being
Unnecessary verb
apply
show examples
the first priority. Drinking fresh
coffee
in Brisbane and
Adelaide
were the lowest participants less than
thirty five
Add a hyphen
thirty-five
show examples
per cent.
Submitted by aninratnasari on

Unauthorized use and/or duplication of this material without express and written permission from this site’s author and/or owner is strictly prohibited. Excerpts and links may be used, provided that full and clear credit is given to Writing9 with appropriate and specific direction to the original content.

Sentences: Add more complex sentences.
Linking words: Don't use the same linking words: "last".
Introduction: The introduction is missing.
Introduction: The chart intro is missing.
Common mistake: Your writing should be 150-250 words.
Basic structure: Change the fourth paragraph.
Introduction: The chart intro is missing.
Vocabulary: Replace the words coffee, cafe, cities, adelaide with synonyms.
Vocabulary: Only 6 basic words for charts were used.
Vocabulary: Use several vocabularies to present the data in the second paragraph.
Vocabulary: Use several vocabularies to present the data in the fourth paragraph.
Topic Vocabulary:
  • survey
  • consumption
  • beverage
  • preference
  • compare
  • quantities
  • supermarkets
  • cafes
  • consume
  • patterns
  • notable
  • significant
  • trends
  • demographic
  • gender
  • habit
  • occasionally
  • frequently
  • cultural influence
  • workdays
  • weekends
  • paraphrase
  • analyze
  • summarize
  • draw conclusions
What to do next:
Look at other essays: