
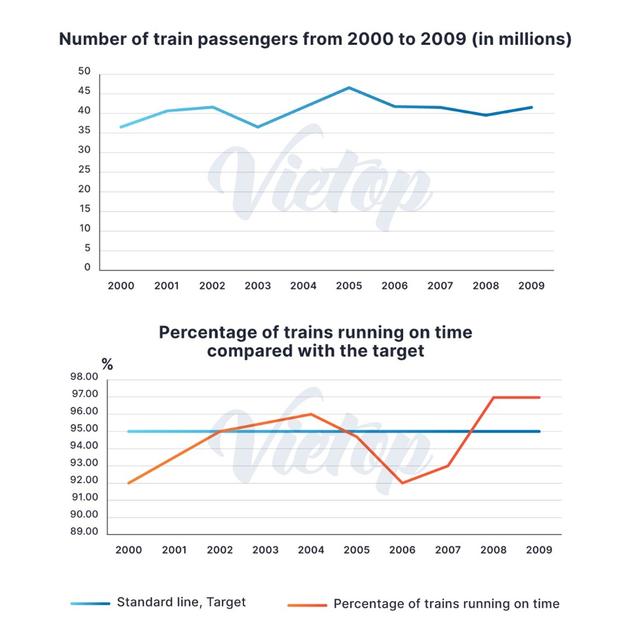
The first chart displays how many passengers used
train
between 2000 and 2009, and the second graph compares the rate of Correct article usage
the train
trains
running on Use synonyms
time
with the Use synonyms
standart
line.
Correct your spelling
standard
Overall
, Linking Words
it is clear that
the number of Linking Words
poeple
, who utilized Correct your spelling
people
trains
slightly increased throughout Use synonyms
period
. Add an article
the period
In addition
, Linking Words
proportion
of the punctual Add an article
the proportion
trains
was lower than the target; Use synonyms
however
, Linking Words
at the end
of the period it was far higher than the target.
Looking more closely at the first image, just above 35 Linking Words
millions
people reached their destinations by Change to singular
million
trains
in 2000, despite some Use synonyms
fluctations
, Correct your spelling
fluctuations
this
figure rose in the following 5 years, and peaked at nearly 46 Linking Words
millions
. Change to singular
million
Then
, there was a slight decline in the number of train passengers,with approximately 42 Linking Words
millions
people who took Change to singular
million
train
in 2009.
Turning to the second graph, the Add an article
the train
a train
standart
line remained stable, at 95%, over the Correct your spelling
standard
time
frame. The rates of Use synonyms
trains
running on Use synonyms
time
were the same in 2000 and 2006, Use synonyms
although
some fluctuations between Linking Words
this
Linking Words
time
frame. From 2006 to 2008, Use synonyms
saw
an increase in the rates of punctual Verb problem
there was
trains
, from 92% to 97%. Use synonyms
Then
, the figure remained unchanged until the end of the period.Linking Words