
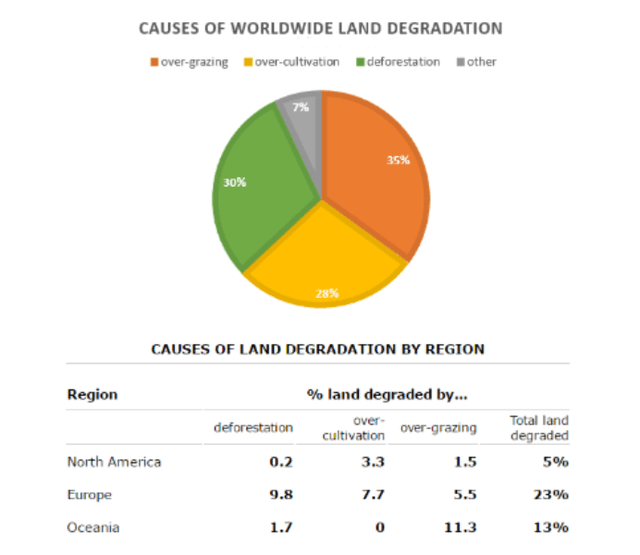
The pie graph depicts the data about the factors
Correct pronoun usage
that led
led
to Change the form of the verb
leading
global
loss of Add an article
a global
the global
land
productivity,Use synonyms
while
the table represents how these contributors had Linking Words
impact
on three areas namely North America,Europe and Oceania(Australia and New Zealand).
Add an article
an impact
Overall
,there are four sectors causing Linking Words
land
erosion which are overplanting crops,cutting down the trees,other factors and over-grazing.Another important point is that Europe`s lands were particularly affected Use synonyms
from
the mentioned treatments.
Over Change preposition
by
one-thirds
of all causes Correct your spelling
one-third
was
Correct subject-verb agreement
were
due to
over-grazing,another 30% Linking Words
caused
by logging the forests and 28% came from over-cultivation,Add a missing verb
was caused
remaining
7% was Correct article usage
the remaining
brought
by other factors.
About a quarter of total Verb problem
caused
land
in Europe was degraded Use synonyms
as a consequence
of deforestation with 9.8% ,over-cultivation with 7,7% and over-grazing with 5,5% contribution making up 23%.Linking Words
However
,in Linking Words
Oceania
over-planting crops had no effect on Add a comma
Oceania,
land
degradation,Use synonyms
while
logging the trees and over-grazing made 1,7% and 11,3% of the Linking Words
land
degraded Use synonyms
accordingly
.In North America only 5% of the soil lost its productivity where 0,2% came from deforestation,3,3% from over-cultivation and 1,5% from over-grazing.Linking Words