
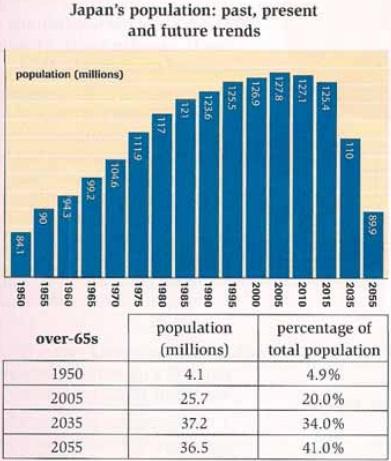
The chart compares the data about
Japanese
population (measured in millions) from 1950 to 2055.
Correct article usage
the Japanese
Overall
, the most populated year was 2005, Linking Words
whereas
the least amount of people lived at the start of the period. Linking Words
Additionally
, the number of people who are older than 65 Linking Words
was
Verb problem
has
increasing
Wrong verb form
increased
during
the years.
Change preposition
over
To begin
with, Linking Words
Linking Words
initially
only 84.1 of Japanese citizens lived in the country, increasing to 104.6 in 1970. After that, it was a great leap to 111,9, consistently growing to 126.9 in 2000. In 2005, 127.8 of Japanese resided in Japan, accounting for the lowest figure in the chart.
Add a comma
initially,
On the other hand
, in 2035, the percentage had dramatically declined to 1.10, and Linking Words
then
even Linking Words
further
to 89.9 by the end of the period. Even though, only 4.9% of Linking Words
total
population were elders (aged 65 and older) living in Japan in 1950, Add an article
the total
this
number significantly rose to 41.0% in 2055.Linking Words