
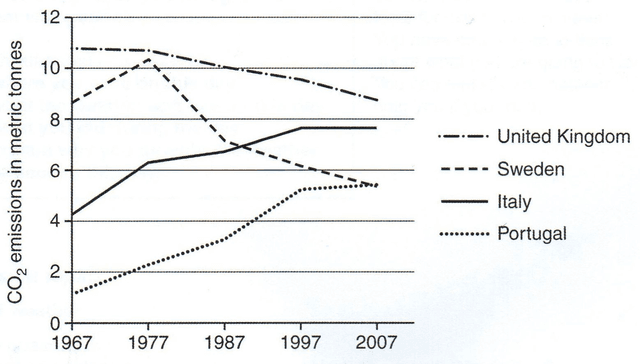
The line chart presents the average of resulting carbon dioxide emissions in society between four countries over 40 years and it is measured in
tonnes
. Use synonyms
Overall
, it can be clearly seen that Linking Words
United
Kingdom was the most contributor Correct article usage
the United
emissions
among others.
Change preposition
to emissions
According to
the data, the trend of UK was went down gradually until reached its lowest point with 9 Linking Words
tonnes
in 2007. Use synonyms
Although
it went down, Linking Words
UK
still remains at the top of the rankings. Correct article usage
the UK
While
Italy had an opposite direction with UK, it rise moderately through years until almost hit 8 Linking Words
tonnes
in 2007 and made it took second place.
Use synonyms
Furthermore
, the movement of Sweden and Portugal was contradicted which Sweden decreased, Linking Words
whereas
, Portugal increased swiftly until both crossed the line with the same amount at 5 Linking Words
tonnes
in 2007 and both of them became the Use synonyms
last
place out of those four nations.Linking Words