The line graph shows visits to and from the UK from 1979 to 1999, and the bar graph shows the most popular countries visited by the UK residents in 1999. Summarize the information and make comparison. Write at least 150 words.

The line graph shows visits to and from the UK from 1979 to 1999, and the bar graph shows the most popular countries visited by the UK residents in 1999. Summarize the information and make comparison. Write at least 150 words.
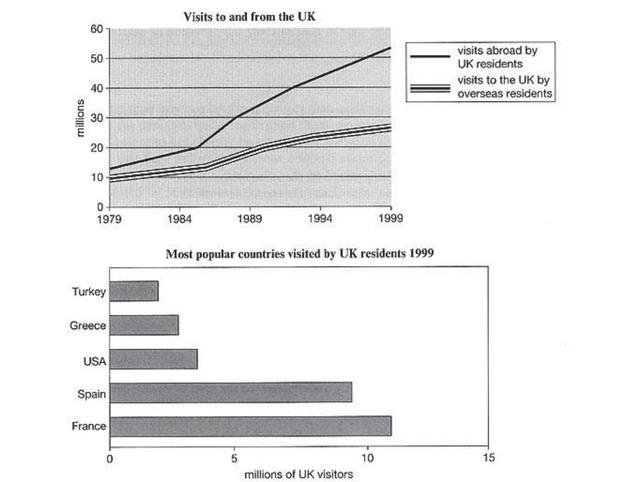
The lines illustrate statistics of
traveling
Change the spelling
travelling
show examples
by UK residents abroad and by other ones to the UK
since
Change preposition
from
show examples
1979 to 1999. It seems to be a dramatic rise over the
last
20 years.
Furthermore
,the quantity of British
tourist
Fix the agreement mistake
tourists
show examples
who travelled abroad and amount of foreign visitors was similar in 1979, but
at the end
of the century, the difference was about 30 million. The bar chart demonstrates the most well-known countries visited by the British trippers. We can note that Spain and France with the largest number of British tourists, amounting to around 11 and 9 million.
In
contrast
Add a comma
contrast,
show examples
Turkey was the least popular country represented,
where
Correct word choice
which
show examples
UK residents took a trip to in 1999.
As a result
, the peak of tourism from and to England was between 1980s and 90s.
In addition
, the majority of trips were made to only 5 countries
Submitted by 6atb8k on

Unauthorized use and/or duplication of this material without express and written permission from this site’s author and/or owner is strictly prohibited. Excerpts and links may be used, provided that full and clear credit is given to Writing9 with appropriate and specific direction to the original content.

Introduction: The introduction is missing.
Introduction: The chart intro is missing.
Common mistake: Your writing should be 150-250 words.
Basic structure: Change the third paragraph.
Introduction: The chart intro is missing.
Vocabulary: Use several vocabularies to present the data in the third paragraph.
What to do next:
Look at other essays: