
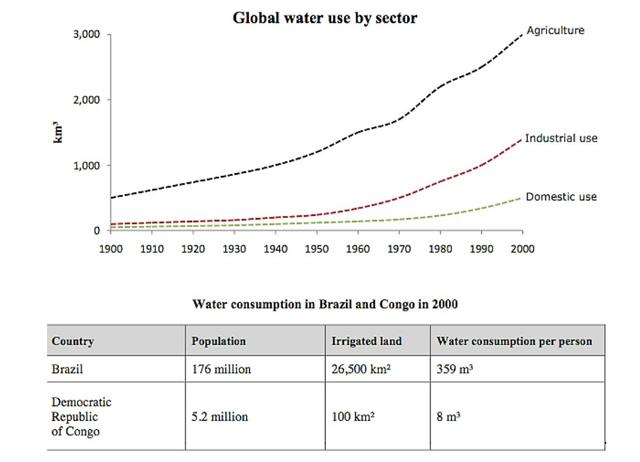
The graph depicts global
water
Use synonyms
use
in three sectors between 1900 and 2000, Use synonyms
while
the table Linking Words
is comparing
Wrong verb form
compares
water
consumption in Use synonyms
Brazil
and the democratic republic of Use synonyms
Congo
in 2000.
Use synonyms
Overall
, Linking Words
water
Use synonyms
use
increased in all sectors during Use synonyms
this
period. Linking Words
In
Linking Words
addition
we can see that agriculture Add a comma
addition,
used
much more Wrong verb form
uses
water
than industry andUse synonyms
the
domestic Correct article usage
apply
use
. Use synonyms
Moreover
, Linking Words
Brazil
used a lot more Use synonyms
water
than Use synonyms
Congo
in all the categories in the table.
First of all, agricultural Use synonyms
water
increased significantly from 500 km3 in 1900 to around 3000 km3 in 2000. The increase came very fast after Use synonyms
1950
maybe because of the Second World War. Punctuation problem
1950,
Secondly
, industrial Linking Words
water
Use synonyms
use
Use synonyms
also
grew a lot during the century. It started approximately 100 km3 and reached around 1200 km3 by 2000. Domestic Linking Words
water
Use synonyms
use
increased more slowly. It starts at under 100 km3 and goes up to 400 km3 Use synonyms
at the end
.
Linking Words
According to
the table at the bottom, Linking Words
Brazil
has a population of 176 million people, and Use synonyms
Congo
has only 5.2 million. Use synonyms
Furthermore
, Linking Words
Brazil
had 26,500 km2 of irrigated land, and Use synonyms
Congo
only had 100 km2. Use synonyms
As a result
, Linking Words
water
consumption Use synonyms
in
person in Change preposition
per
Brazil
was much higher, with 359 m3, compared with only 8 m3 in Use synonyms
Congo
. Use synonyms
This
is a very important difference.Linking Words