The pie charts below show the percentage of time working adults spent on different activities in a particular country in 1958 and 2008. Summarise the information by selecting and reporting the main features and make comparisons where relevant

The pie charts below show the percentage of time working adults spent on different activities in a particular country in 1958 and 2008. Summarise the information by selecting and reporting the main features and make comparisons where relevant
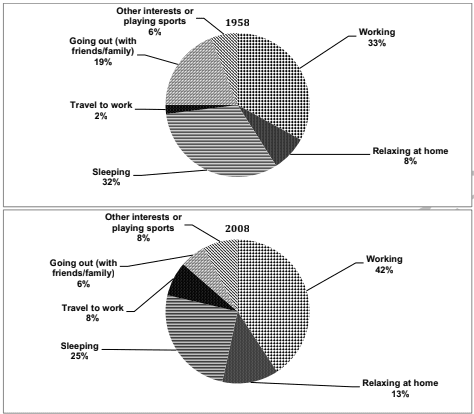
The given charts illustrate the percentage of adults
time consuming
Add a hyphen
time-consuming
show examples
in six different activities in a particular country from 1958 to 2008.
Overall
, travel to work and sleeping experienced a decreasing trend
while
working and other activities
remaining
Wrong verb form
remained
show examples
increased in the given period. As can be seen from the charts, the percentage of adults who spent their
time
sleeping diminished
Change preposition
by
show examples
7% followed by going out with friends/family which experienced a decreasing trend as well at 12%.
Conversely
, an uplifting trend occurred in the working category with
9
Correct article usage
a 9
show examples
% increase from 1958 to 2008, and it
also
ensued in the going out with friends/family and relaxing at home categories; 5% and 13 % respectively. Other interests or playing sports was the least activity which
also
increased at only 2 % in the given period. Generally, most adults spend their
time
working and sleeping
while
only a little of their
time
is allocated to travel to work and other interests.
Submitted by misstiasclassroom on

Unauthorized use and/or duplication of this material without express and written permission from this site’s author and/or owner is strictly prohibited. Excerpts and links may be used, provided that full and clear credit is given to Writing9 with appropriate and specific direction to the original content.

Linking words: Don't use the same linking words: "also, while".
Basic structure: Change the third paragraph.
Vocabulary: Rephrase your introduction. Words match: 75%.
Vocabulary: Replace the words time with synonyms.
Vocabulary: Rephrase the word "percentage" in your introduction.
Vocabulary: Only 6 basic words for charts were used.
Vocabulary: The word "charts" was used 2 times.
Vocabulary: The word "give" was used 3 times.
Vocabulary: The word "percentage" was used 2 times.
Vocabulary: The word "trend" was used 3 times.
Vocabulary: The word "increased" was used 3 times.
Vocabulary: Use several vocabularies to present the data in the third paragraph.
What to do next:
Look at other essays: