
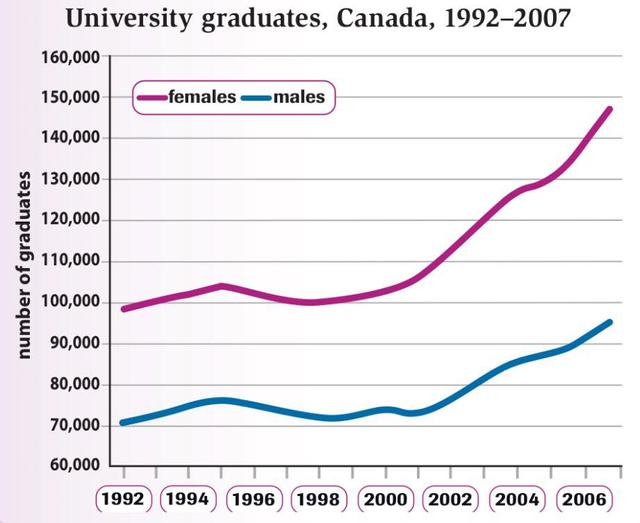
The given line graph demonstrates the data about the proportion of students passed out from educational
entity
Fix the agreement mistake
entities
of
Change preposition
in
Change the capitalization
Canada
canada
during the time period of 1992 to 2007
Change the capitalization
Canada
Overall
, it can be seen that the ratio Linking Words
male
graduates Change preposition
of male
were
increased gradually Unnecessary verb
apply
while
the number of female students showed a Linking Words
fluctuated
incline during the period of 1992 to 2007.
Replace the word
fluctuating
To begin
with, the proportion of men Linking Words
were
stood at 99,000 in 1992. Unnecessary verb
apply
This
is followed by Linking Words
slight
increase Correct article usage
a slight
upto
105,000 during the subsequent Correct your spelling
up to
two year
period (1994). Add a hyphen
two-year
Linking Words
However
it showed Add a comma
However,
decline
to reach a Add an article
a decline
pleatue
state Correct your spelling
pleasure
at
100,000 for consecutive two years (1996-1998. Change preposition
of
Meanwhile
it Add a comma
Meanwhile,
got
increased gradually from 100,000 in 1998 to 129,000, where it surged up to Verb problem
apply
maximum
of approximately 149,000 in 2007.
Moving Add an article
a maximum
to
the next data in Change preposition
apply
graph
shows that in 1992, the number Correct article usage
the graph
for
women Change preposition
of
learner's
Change noun form
learners
were
at 70,000 Correct subject-verb agreement
was
whiich
was moderately inclined to 75,000 in 1994.Correct your spelling
which
Howbit
in 1996 to 1998, the proportion of female graduates were decreased to 72,000 and 71,000 respectively.
The line graph for female graduates showed more fluctuation with Correct your spelling
Howbeit
dip
,at 72,000 in 2000, before reaching to highest value (99,000 in 2007)Correct article usage
a dip