
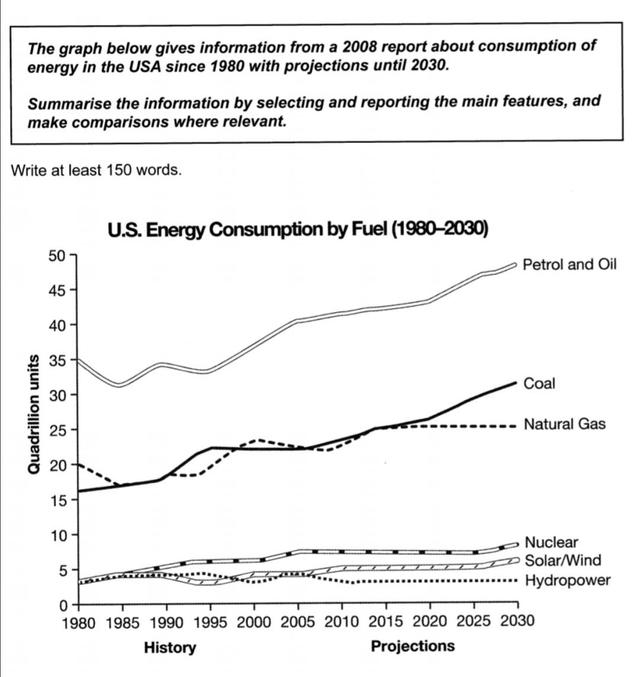
The graph below illustrates energy usage in the USA since 1980, with projections for 2030 reported in 2008. The
units
are represented in quadrillion Use synonyms
units
. Notably, Petrol and Oil consistently held the highest consumption, Use synonyms
while
Hydropower consistently registered the lowest.
Petrol and Oil began at a high of 35 Linking Words
units
and steadily increased, with a projection to reach 50 Use synonyms
units
by 2030. Coal followed closely behind, starting at approximately 17 Use synonyms
units
and predicted to nearly double. Natural Gas and Coal had similar starting values, with Natural Gas starting at 20 Use synonyms
units
and experiencing a slight increase to around 25 Use synonyms
units
.
Three categories, Nuclear, Solar/Wind, and Hydropower, all began at approximately 4 Use synonyms
units
. Among these, Nuclear was projected to have the highest increase, reaching around 7 Use synonyms
units
by 2030. Use synonyms
Conversely
, Solar/Wind and Hydropower remained at relatively low levels and were predicted to maintain stagnant numbers.Linking Words