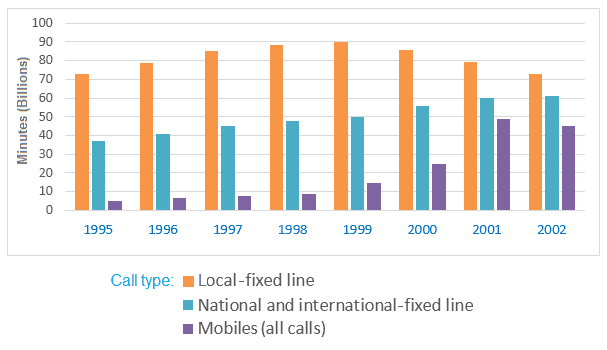
IELTS Writing Task Chart for The chart below shows the total number of minutes (in billions) of telephone calls in the UK, divided into three categories, from 1995-2002.
Unauthorized use and/or duplication of this material without express and written permission from this site's author and/or owner is strictly prohibited. Excerpts and links may be used, provided that full and clear credit is given to Writing9 with appropriate and specific direction to the original content.
Sentences: Add more complex sentences.
▼
Linking words: Add some linking words.
▼
Linking words: Add linking words.
▼
Introduction: The introduction is missing.
▼
Introduction: Change the first sentence in the introduction.
▼
Introduction: The chart intro is missing.
▼
Basic structure: Write more paragraphs.
▼
Basic structure: Add more body paragraphs.
▼
Common mistake: Your writing should be 150-250 words.
Introduction: The chart intro is missing.
▼
Basic structure: Write more paragraphs.
▼
Vocabulary: Only 1 basic words for charts were used.
At present, the hiring process has become more complex and competitive in the job market, and priorities various qualities are often employed when evaluating job applicants. Some people argue that not only academic qualifications are highly required, but also extroversion is also have great importance. This essay supports the assertion to a major extent despite some inhibitions.
It is true that the inequality between rich and poor nations is now wider than ever before. This essay will discuss the main causes of this issue and suggest some possible solutions to reduce the gap.
t is argued that the benefits of English becoming the lingua franca are more significant than its drawbacks. Although this tendency can pose a threat to some minority languages, I mostly agree with this notion since it facilitates smoother communication and employment opportunities.
This is currently a contentious argument over whether to plant trees in rural areas or construct new houses and apartments. I totally agree with this opinion due to a vast range of reasons and some of them will be addressed in this essay.