
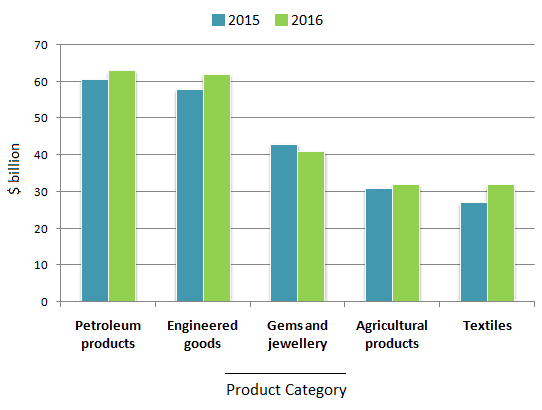
The provided chart gives information about the number of export earnings of different five categories in a particular country during 2015 and 2016.
Whereas
the table compares the changing percentages of the items in both years.
Linking Words
Overall
, petroleum, engineered, agricultural Linking Words
products
, and textiles experienced an increase during the given period. Use synonyms
In contrast
, games and jewellery have shown the opposite trend
Linking Words
To begin
with, in 2015, the export of petroleum Linking Words
products
was nearly 60 Use synonyms
billion
dollars, Use synonyms
this
figure slightly rose by 3% in the next year. A similar pattern can be seen for the engineered Linking Words
products
which was above 50 Use synonyms
billion
earned in 2015, the following year, the number of earnings increased to 61 Use synonyms
billion
dollars. Regarding agricultural Use synonyms
products
, did not exceed 35 Use synonyms
billion
in both years.
Use synonyms
Although
textiles had the lowest earnings category at 25 Linking Words
billion
in 2015, it had the highest growth in 2016 by 15,24%. Games and jewellery exports were 42 Use synonyms
billion
Use synonyms
then
declined by 5,18$ in comparison to 2016.
In conclusion, all the five categories accounted for upward trends, Linking Words
while
games and jewellery export were the exceptional categories which decreased.Linking Words