
Remarkable information is provided regarding the amount of
visitors
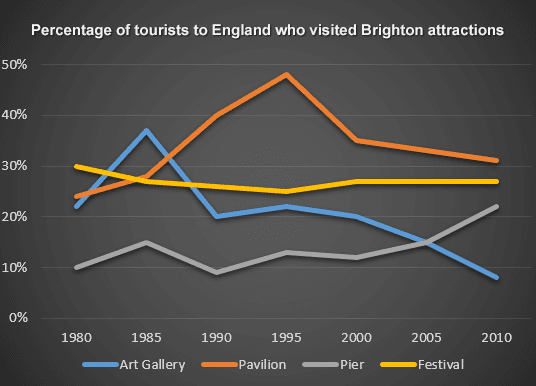
who went to the Brighton local attractions, over a 12-year interval, commencing in 1980 and culminating in 2010.
From an Use synonyms
overall
perspective, it can be seen despite the fact that art galleries had a decreasing trend, all other attractions gained fame among individuals and the Pavilion had the most Linking Words
visitors
in the majority of Use synonyms
years
.
By a closer examination, it is obvious that Use synonyms
Pavilion
stood at 25% in 1980 and experienced a dramatic increase to the adjacent of 50% during 15 Correct article usage
the Pavilion
years
, before decreasing to 30% in 2010. Use synonyms
Besides
that, in 1980 Linking Words
visitors
Use synonyms
of
Change preposition
to
the
art galleries were about 20% of the people which in the next 5 Correct article usage
apply
years
it rose to the vicinity of 40% before declining to its' start point in 1990. After that, it sank to
8% Use synonyms
at the end
of the duration.
Turning to Pier's Linking Words
visitors
, by neglecting the fluctuations, it had a growing trend which started at 10% and ended at 22% in 2010. The odd one was the rate of people who went to the festivalUse synonyms
,
since it had only a slight decrease from 30% during those Remove the comma
apply
years
.Use synonyms