
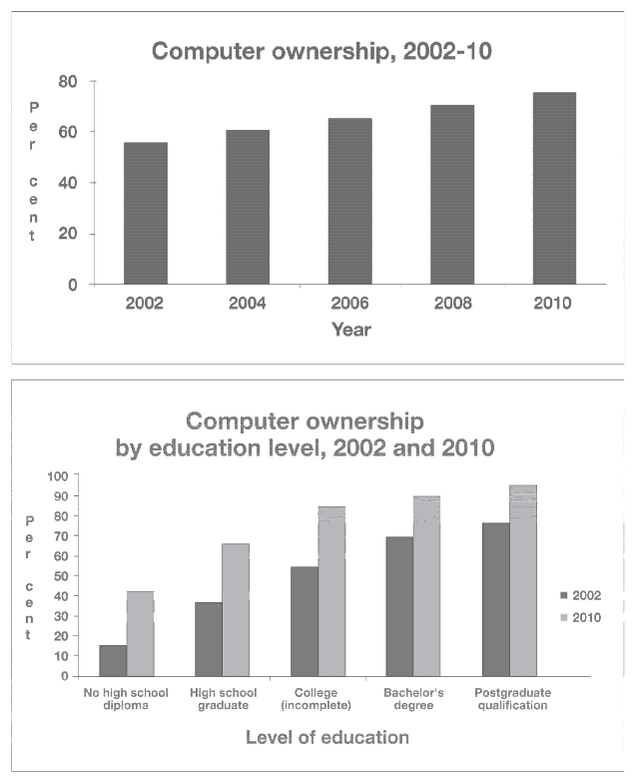
The bar graphs depict data of people who have their own
computer
in Use synonyms
percentage
over a span of eight years from 2002 to 2010, and the information by showing the five types of education Use synonyms
level
in 2002 and 2010.
Fix the agreement mistake
levels
Overall
, the first graph reveals that the Linking Words
percentage
of Use synonyms
population
in 2010 outpaced Add an article
the population
in
2002 among all kinds of school levels. The trend of data was gradually increased from 2002 to 2010. It is obvious that the highest number of people who have personal Correct word choice
that in
Use synonyms
computer
was in 2010, Fix the agreement mistake
computers
whereas
the Linking Words
least
amount of Correct word choice
lowest
computer
owners was in 2002.
Use synonyms
According to
students who Linking Words
were
in non-high school diploma, the Verb problem
had
percentage
of their own Use synonyms
Use synonyms
computer
went up significantly more than a half compared to 2002 and 2010, Fix the agreement mistake
computers
estimate
at 25 Change the form of the verb
estimated
percents
. Meanwhile, Fix the agreement mistake
percent
Use synonyms
percentage
of high school Correct article usage
the percentage
graduate
and college were Fix the agreement mistake
graduates
also
surged.
Looking at Linking Words
Correct article usage
the master
master
degree level, the data Change noun form
master's
of
having Change preposition
on
Use synonyms
computer
was 75 Add an article
a computer
percent
in 2002 Change the spelling
per cent
while
in 2010 was nearly Linking Words
reach
Wrong verb form
reached
to
90 Change preposition
apply
percent
, which was the highest category of education level compared to the others in the same year.Change the spelling
per cent