
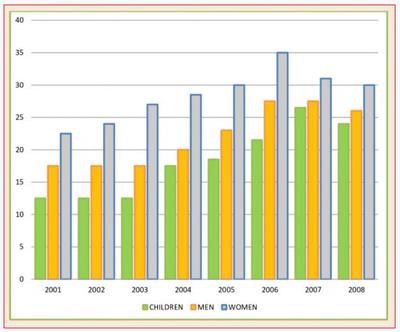
The bar chart illustrates how many children, men, and women in the UK ate five portions of fruit and vegetables every day, between 2001 and 2008. Looking from an
overall
perspective, it is readily apparent that during Linking Words
this
period, the vast majority of fruit and vegetables were eaten by females, followed by males and kids.
It can be seen that females dominated the consumption over the years. Starting with about 23% in 2001, showed great growth until 2006 and achieved approximately 35% before it Linking Words
finally
declined to 30% in the Linking Words
last
era. Males were ranked second in all years, beginning at around 17% for the first three years, and slightly improving to almost 27% Linking Words
thereafter
.
For the young ones, it was clearly evident that no more than 15% of kids in the UK consumed fruit and vegetables in the period 2001 - 2003. The first improvement was seen in 2004, reached nearly 17% and continued to attain its peak in 2007 with more than a quarter. Linking Words
At the end
of the year, it dropped and made close to 24% in 2008.Linking Words