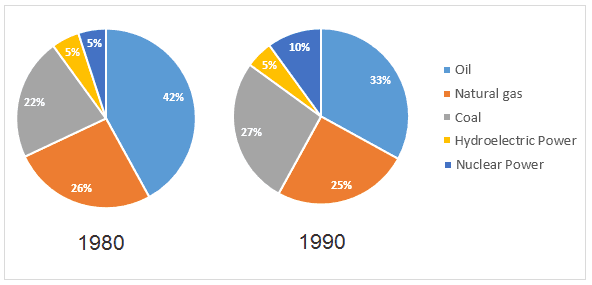
The two graphs show the main sources of energy in the USA in the 1980s and the 1990s. Write a report for a university lecturer describing the changes which occurred.

The two graphs show the main sources of energy in the USA in the 1980s and the 1990s.

Write a report for a university lecturer describing the changes which occurred.
These pie charts depict the percentage of the main sources in the US in two
decide
Replace the word
decisions
show examples
. It is from the graph that, there are five essential sources.
According to
what is shown, in 1980, as we can see oil was the most resource used, after
that
Add a comma
that,
show examples
we have natural gas nearly considered a quarter, about 10 per cent left is minor. In 1990, we have oil as the most popular one in that era by the
third,
we can see the natural source taken the quarter of the useg, slightly over the quarter we can see coal by 27 per cent, they had used the power of the hydroelectric and the energy of the nuclear and that represents just 15 per cent.
To sum up
, we could say that the two graphs are approximately the same, there are a few differences,
such
as the oil we can see a decrease of around 9%.
Submitted by ad7learn on

Unauthorized use and/or duplication of this material without express and written permission from this site’s author and/or owner is strictly prohibited. Excerpts and links may be used, provided that full and clear credit is given to Writing9 with appropriate and specific direction to the original content.

Introduction: The introduction is missing.
Introduction: Change the first sentence in the introduction.
Introduction: The chart intro is missing.
Vocabulary: The word "graph" was used 2 times.
Vocabulary: Use several vocabularies to present the data in the first paragraph.
Vocabulary: Use several vocabularies to present the data in the fourth paragraph.
What to do next:
Look at other essays: