
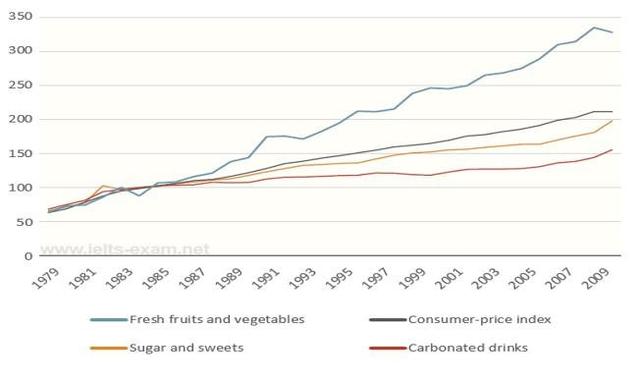
The line graph illustrates the tariff changes for several types of food
along with
the Linking Words
consumer
price Use synonyms
index
from 1978 to 2009.
Use synonyms
Overall
, the prices of sugar-contained foods and carbonated drinks remained below the Linking Words
consumer
Use synonyms
index
, which contradicts the huge discrepancy in fresh fruits and Use synonyms
vegetables’
prices throughout the given period.
In the beginning, the fees for the foods and Correct your spelling
vegetables
consumer
Use synonyms
index
were relatively similar, at more than 50 Use synonyms
million
US Use synonyms
dollars
. Use synonyms
Subsequently
, the price trends for sugar and sweets, carbonated drinks, and the Linking Words
consumer
Use synonyms
index
grew steadily, Use synonyms
which
surpassing 100 Correct pronoun usage
apply
million
US Use synonyms
dollars
in 1987. Use synonyms
Then
, the tariff escalated until it showed a significant gap between the three of them of approximately 50 Linking Words
million
US Use synonyms
dollars
Use synonyms
at the end
of the period.
Linking Words
On the other hand
, the prices of fresh fruits and vegetables have dramatically increased since 1987, with several fluctuations, from over 100 Linking Words
million
US Use synonyms
dollars
to eventually triple in 2009 to above 300 Use synonyms
million
US Use synonyms
dollars
.Use synonyms