
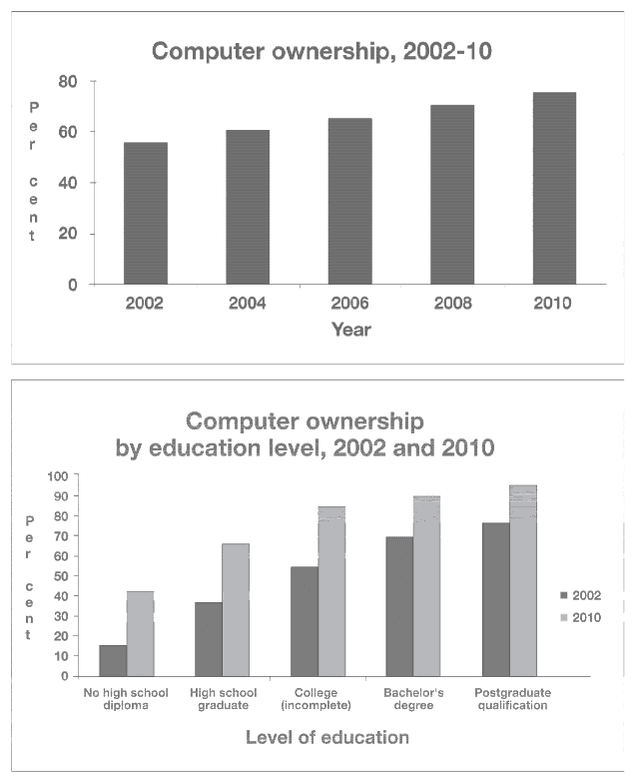
Depicted in the bar charts are data about computer ownership as a percentage of the population between 2002 and 2010. It
also
compares the level of education for the years 2002 and 2010.
Linking Words
Overall
, it can be observed from the top graph that computer Linking Words
ownerships
had a steady growth from 2002 to 2010. Fix the agreement mistake
ownership
Furthermore
, the highest bar was in 2010 with approximately 70%. Linking Words
Moreover
, The bottom graph illustrates computer ownership by categorizing it into 5 different education levels. The highest bar went to people with postgraduate Linking Words
qualification
with 80% in 2002 and 95% in 2010 . Fix the agreement mistake
qualifications
On the other hand
, the lowest went to those with no high school diploma with approximately 15% in 2002 and 40% in 2010.
Another noteworthy aspect is the gap in the second graph. The first place was college students with approximately a 30% gap. The second was those with no high school diploma, with approximately Linking Words
25
% gap.Correct article usage
a 25