
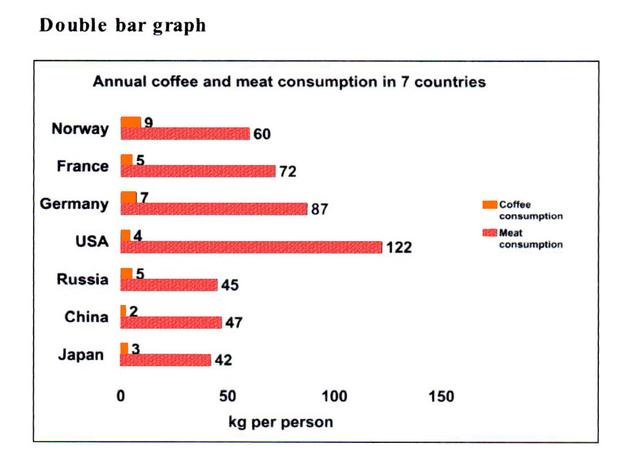
The following bar chart describes the annual consumption of coffee and
meat
amongst three European Use synonyms
countries
, three Use synonyms
Asian
Use synonyms
countries
and the only American country, the USA. The variables involved in Use synonyms
this
double bar chart are the country and kg per person for both Linking Words
food
. Change to a plural noun
foods
Overall
, it can be illustrated that Linking Words
meat
is by far the most consumed product.
Use synonyms
In addition
, the USA Linking Words
meat
consumers are widely attracted to Use synonyms
this
product, they eat approximately three Linking Words
time
more than Change to a plural noun
times
Asian
Use synonyms
countries
combined. Use synonyms
In contrast
, Linking Words
European
population consume in Correct article usage
the European
a
interval from 60 to 90 kg, being surpassed by Change the article
an
American
people.
Correct article usage
the American
However
, Linking Words
European
population Correct article usage
the European
take
Wrong verb form
has taken
the
leadership in Correct article usage
apply
coffee's
consumption. Change noun form
coffee
Nevertheless
, the range of dispersion is close in front of American and Linking Words
Asian
nations. In spite of Use synonyms
this
, Linking Words
Asian
Use synonyms
countries
show good Use synonyms
Kurtosis's
variation because the variance between both factors Change noun form
Kurtosis
are
closer than Change the verb form
is
Change preposition
in others
others
Correct quantifier usage
other
countries
.
Use synonyms
To conclude
, Linking Words
meat
as a favourite good is incredibly accepted by most of the First-World nations. Use synonyms
Nonetheless
, the coffee is vaguely eaten.Linking Words