
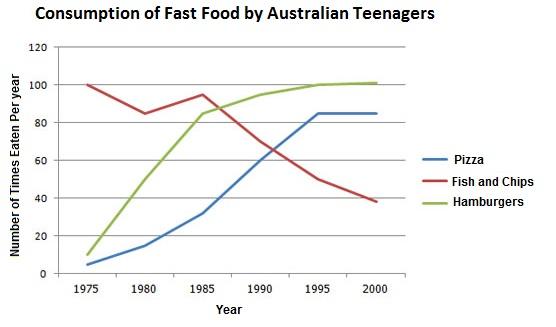
The line graph illustrates the fluctuations in the amount and type of fast food consumed by Australian teenagers
during
1975 to 2000.
Change preposition
from
Overall
, the consumption rate of hamburgers and pizza increased significantly Linking Words
whereas
, that of fish and chips decreased drastically.
In 1975, the number of times fish and chips Linking Words
was
eaten stood at 100 per Correct subject-verb agreement
were
year
. Use synonyms
After
Linking Words
this
, the ingestion of fish and chips experienced fluctuation for a Linking Words
period
of 10 years and Use synonyms
then
plunged over the following 15 years to 40 per Linking Words
year
in 2000.
Use synonyms
In contrast
to Linking Words
this
, there was a dramatic growth in the consumption of hamburgers and pizza over the Linking Words
period
. The ingestion of hamburgers was at a low of 10 per Use synonyms
year
and Use synonyms
then
rose steadily over Linking Words
years
and was at the peak of consumption in 2000 at 100 per Correct article usage
the years
year
.
Pizza followed Use synonyms
similar
pattern, beginning the Add an article
a similar
period
with approximately 5 per Use synonyms
year
and inclined to 85 per Use synonyms
year
in 1995 and remained stable till the end of the Use synonyms
period
in 2000.Use synonyms