
The bar chart presents 10
countries
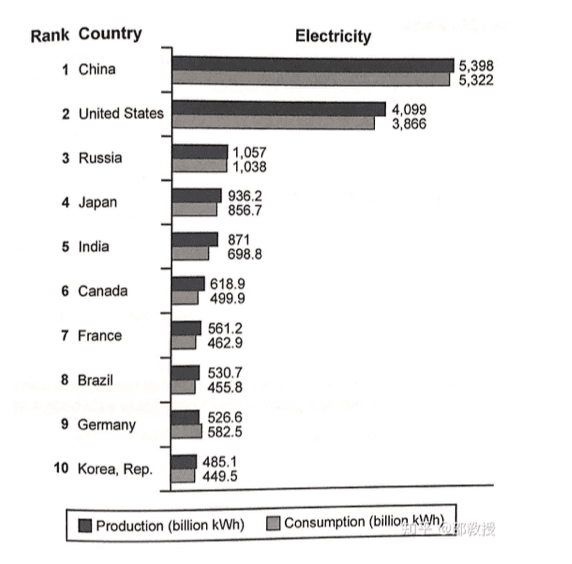
with electricity usage and generation in 2014.
Use synonyms
Overall
, the data can be grouped by two trends with the highest and lowest figures. The Linking Words
first
Use synonyms
one
is represented by two Use synonyms
countries
, Use synonyms
whereas
the second Linking Words
one
is composed of eight others. Notably, nine of ten Use synonyms
countries
produce more electricity than they use with Use synonyms
one
exception - Germany.
In the Use synonyms
first
group, China is shown as the biggest producer and consumer of electriс energy in general. Use synonyms
Also
, the USA figures are lower at about 25%. Linking Words
In contrast
, the USA's production surpassed its consumption compared to China's, with a difference ranging from about 3 to 5%.
In the second group, we see Linking Words
countries
with indicators five times lower than the Use synonyms
countries
from the Use synonyms
first
Use synonyms
one
. The discrepancy between the Use synonyms
first
and the Use synonyms
last
items is 50%. Having said that, the lowest numbers belong to the Korean Republic (slightly less than 500) and the highest to Russia (a bit more than 1000). Germany's consumption is unique because of exceeds the production of electricity by nearly 1%.Linking Words