
The line graph depicts the data from a 2008 report about energy
that is
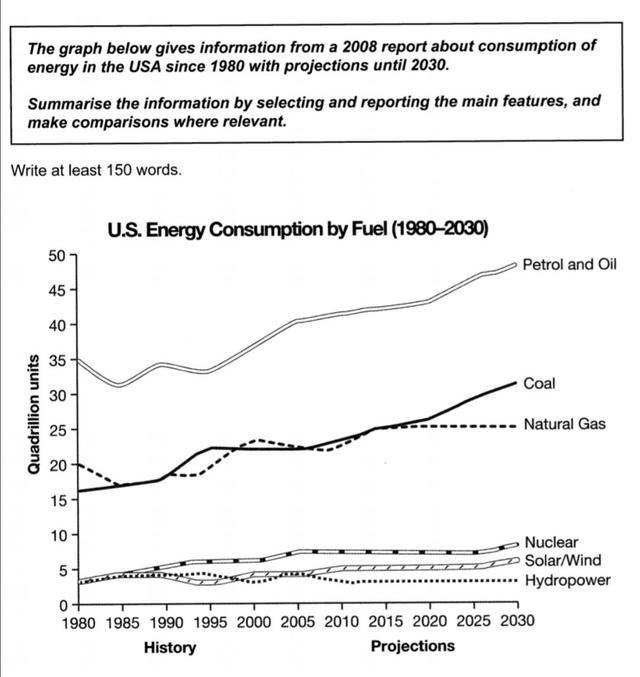
being consumed by the USA between 1980 and 2030.
Linking Words
Overall
, the graph illustrates that the first place in consumption was petrol and oil Linking Words
while
nuclear, solar and hydropower were less consumed in the USA both in 1980 and 2030.
It can be seen from the line graph that petrol and oil were eaten by the USA by about 35 Linking Words
quadrillion
Use synonyms
units
in 1980 and fluctuated over the period, after that these Use synonyms
units
increased gradually approximately to half Use synonyms
at the end
of the period. Coal was lower than natural Gas Linking Words
almost
5 Change preposition
by almost
quadrillion
Use synonyms
units
(15) in the first period, Use synonyms
however
, it had significant growth after 50 years and reached approximately 30 Linking Words
quadrillion
Use synonyms
units
Use synonyms
whereas
Natural Gas consumed only 30.
Nuclear, solar Linking Words
and
wind and hydropower started with a little bit lower than 5 Correct word choice
apply
quadrillion
Use synonyms
units
together in 1980, but nuclear took the leading position in comparison to other types of energy in 2030. Use synonyms
Finally
, hydropower had the lowest consumption of all energy in Linking Words
this
given list.Linking Words